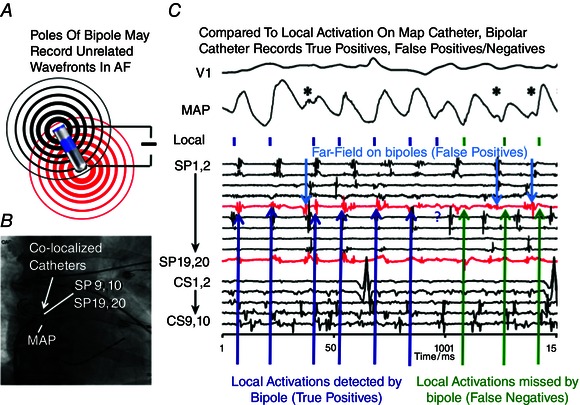
Figure 3. Limitations of electrogram based activation mapping in AF .

A, poles of a clinical bipolar electrode may record unrelated wavefronts in AF. B, fluoroscopic view of co‐localized MAP, bipolar catheters in human atrium. C, MAP in human right atrium indicate local activation (small vertical bars) from far field (asterisks). Notably, bipolar signals (in red) can indicate actual local activation (true positives), show no deflection (false negatives) and show signals that reflect far‐field electrograms (false positives). (Modified from Narayan et al. 2011 b.)
