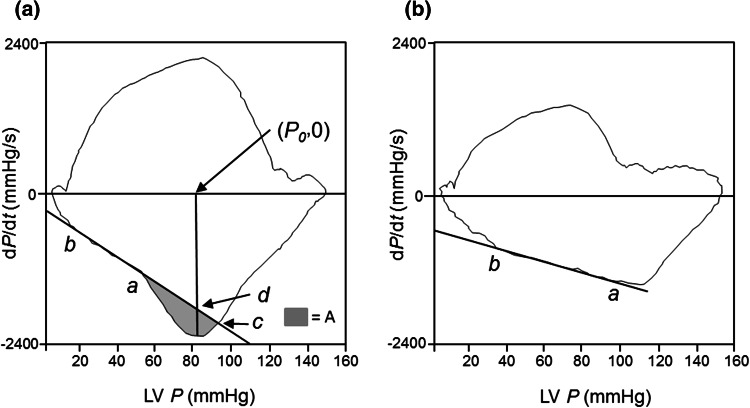
Fig. 1.
Left ventricular (LV) pressure (P)–first derivative of LV P (dP/dt) relationship (phase loop). Loops were obtained from patients with (a) and without (b) inertia stress (IS). The negative inverse slope of the best linear-fitting line (dP/dt_linear) between points a and b is equal to the time constant of exponential pressure decay during isovolumic relaxation (Tp). The Tp was 56.3 ms in panel a and 83.1 ms in panel b. Grey shading area (A) in the left panel denotes an area enclosed by the measured P−dP/dt curve and the dP/dt_linear, A = integral_P(a)∧ P(c)(dP/dt − dP/dt_linear)dP, where P(a) is the pressure at point a and P(c) is the pressure at point c which is defined as the intersection of P−dP/dt curve and dP/dt_linear. The area A divided by the vertical distance between (P 0 , 0), and point d is equal to the amount of pressure decay augmented by the effect of the inertia of blood flowing out of the left ventricle, and is defined as the IS. The IS was 3.6 mmHg (479.9 Pa) in panel a and 0.12 mmHg (16.0 Pa) in panel b

