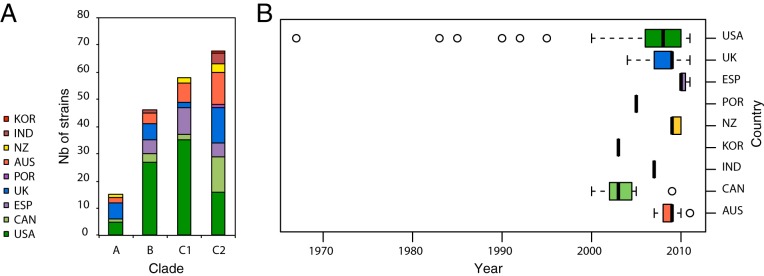
FIG 1 .
Geographical diversity of the combined data set across clades and time. (A) Stacked histogram showing the number of strains in clades A, B, C1, and C2 according to their country of origin. The color scheme is shown in the legend on the left along with abbreviated country names. (B) Box-and-whisker plot showing the distribution according to year of isolation for all strains based on their country of origin. Country abbreviations: KOR, South Korea; IND, India; NZ, New Zealand; AUS, Australia; POR, Portugal; UK, United Kingdom; ESP, Spain; CAN, Canada; USA, United States of America.

