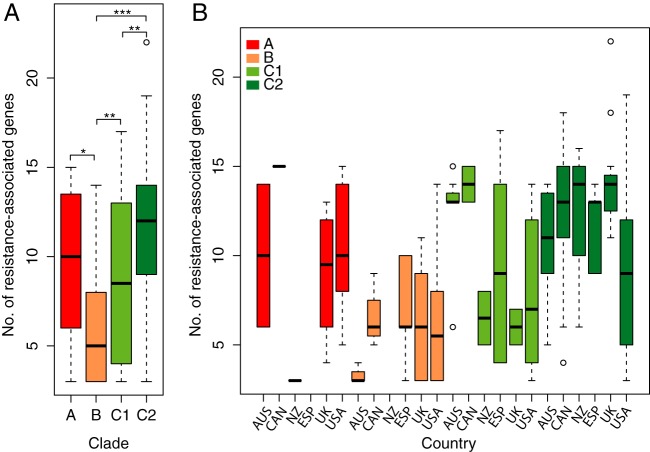
FIG 3 .
Prevalence of antibiotic resistance-associated genes by (A) clade alone and (B) clade and country. The box-and-whisker plot shows the number of resistance-associated genes per (A) clade and (B) per clade and country. Colors correspond to clades as follows: clade A, red; clade B, orange; clade C1, light green; and clade C2, dark green. Screening was done using Srst2 (42) against ARGannot, with a minimum of depth of 15× read coverage. No., number. Country abbreviations: AUS, Australia; CAN, Canada; NZ, New Zealand; ESP, Spain; USA, United States of America; UK, United Kingdom. P values are indicated as follows: ***, P < 0.001; **, P < 0.01; and *, P < 0.05.

