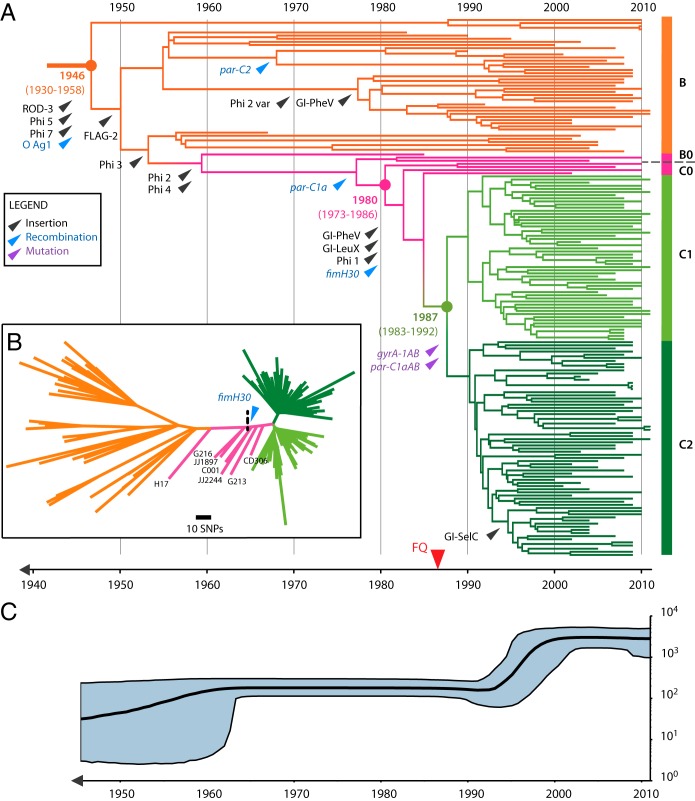
FIG 4 .
Evolutionary scenario of the emergence of ST131 clades (B and C) A time-calibrated phylogeny was reconstructed using BEAST 2.0 based on 3,779-bp nonrecombinant SNPs for the 172 clade B and C strains. Of all combinations tested (see the summary of BEAST analysis results in Data Set S1 in the supplemental material), the one combining the GTR substitution model, a constant relaxed clock model, and the Bayesian skyline population tree model was preferred. (A) Maximum clade credibility tree colored according to clade origin as shown on the right with B in orange, intermediate B0 and C0 in pink, C1 in light green, and C2 in dark green. The x axis indicates emergence time estimates of the corresponding strains. Major evolutionary events are also indicated by an arrow pointing at the branch onto which they are predicted to have occurred (the position along the branch is arbitrary). Three categories of major events are displayed, namely, MGE and genomic island (GI) insertion events in black, allelic change acquired through recombination events in blue, and allelic change acquired through point mutation events in purple. Of note, the two point mutations indicated by purple arrowheads and pointing at the branch from which clades C1 and C2 originate confer resistance to fluoroquinolone, for which the first introduction is indicated in the bottom timeline by a red arrowhead. (B) Unrooted phylogenetic tree built on the same 3,779-bp nonrecombinant set of SNPs using maximum likelihood (ML). Branch support was performed by 1,000 bootstrap replicates. Intermediate strain names and predicted acquisition of fimH30 are indicated on the tree. (C) The Bayesian skyline plot illustrates the predicted demographic changes of the ST131 clade B and C population since the mid-1940s. The black curve indicates the effective population size (Ne), with 95% confidence intervals shown in blue.

