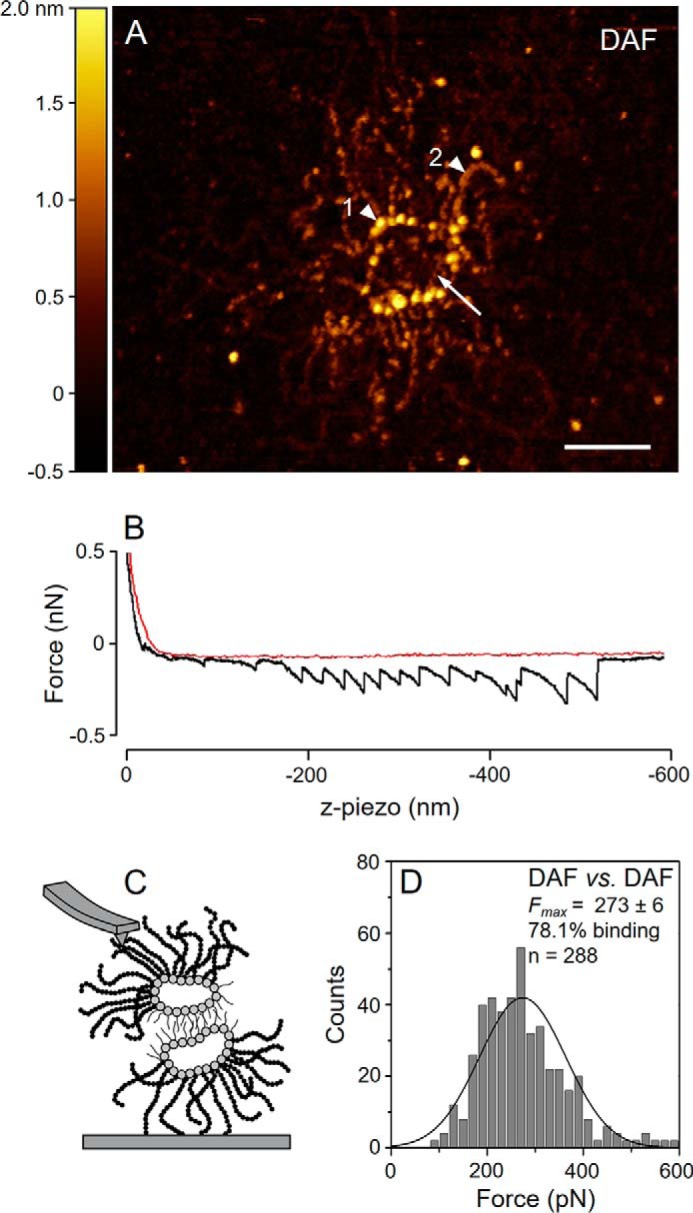
FIGURE 1.

Molecular structure and self-interaction profile of purified DAF. A, high resolution AFM image of DAF. Arrowheads indicate the sunburst-shaped protein core composed of a ring (1▶) and several arms (2▶). The arrow indicates the position of DAF-sulfated polysaccharides (DaSP). Scale bar = 100 nm. B, typical saw-tooth profile of a DAF self-interaction. SMFS curve obtained in the approach (red) and retract (black) cycles. C, schematic drawing of the expected topography of interacting DAF molecules in SMFS experiments, modified from Fernàndez-Busquets et al. (15). D, force histogram of DAF self-interaction forces for the last binding events measured at a retraction velocity of 2000 nm·s−1; the inset value for Fmax refers to the mean ± S.E. pN. The self-interaction assays (panels B and D) were performed in CMFTSW supplemented with 10 mm CaCl2.
