FIGURE 8.

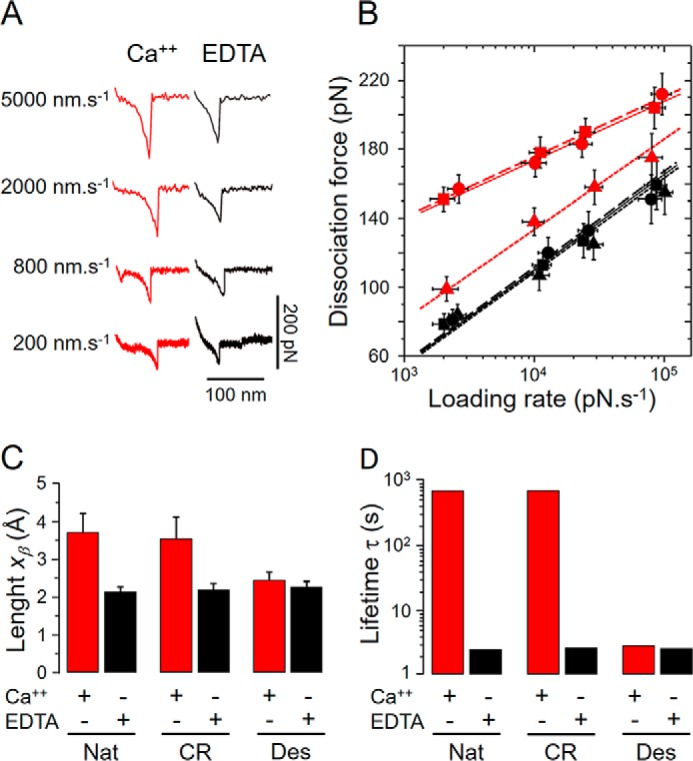
DFS analysis of the self-interactions between native and chemically modified DaSP. A, typical force curves of native DaSP obtained in the presence (red) or absence (black) of calcium with different retract velocities. B, DFS plot of native (circles, solid lines), carboxyl-reduced (squares, dashed lines), and desulfated (triangles, dotted lines) DaSP in the presence (red) or absence (black) of calcium showing the measured dissociation forces against the respective loading rates in a semi-logarithmic scale. C, reaction lengths xβ (mean ± S.D.) of the self-interactions between native (Nat) and carboxyl-reduced (CR) and desulfated (Des) DaSP in the presence (Ca2+, red) or absence (EDTA, black) of calcium. D, mean lifetime τ (koff−1) of the self-interactions between native (Nat) and carboxyl-reduced (CR) and desulfated (Des) DaSP in the presence (Ca2+, red) or absence (EDTA, black) of calcium plotted in a logarithmic scale.
