FIGURE 3.
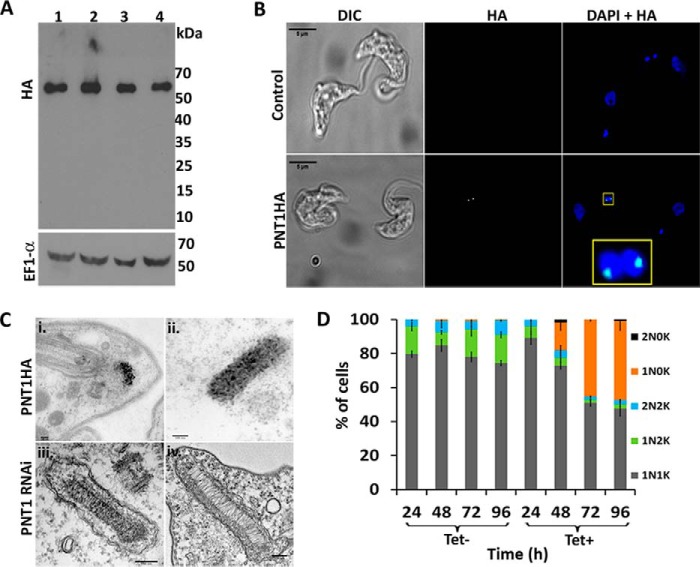
Phenotype analysis of PNT1 RNAi, PNT1HA, and PNT1Myc cell lines. A, expression of recoded PNT1HA in the PNT1 RNAi cell line. Lysates of PNT1 RNAi cells expressing recoded PNT1HA (lanes 1 and 2) or recoded PNT1HAC136S (lanes 3 and 4) before (lanes 1 and 3) and after (lanes 2 and 4) tetracycline induction were immunoblotted and probed with anti-HA antibody. EF1α was used as loading control. B, immunofluorescence of PNT1HA expressed in tetracycline induced PNT1 RNAi cell line (lower panel) shows localization within or near antipodal sites. Uninduced PNT1 RNAi cell lines (upper panel) were used as a control. The cells were stained with anti-HA antibody (green) and DAPI (blue). A stained, nearly duplicated kinetoplast (yellow box) is shown in magnified view. Scale bar, 5 μm. C, i and ii, immunogold labeling of PNT1HA cell line using anti-HA antibody after 72 h of RNAi induction. Scale bar, 100 nm. iii and iv, electron micrographs of PNT1 RNAi uninduced (iii) and 72 h tetracycline-induced (iv) cells (scale bar, 150 nm). D, PNT1 RNAi cells induced with tetracycline (Tet+) were stained with DAPI and the number of nuclei (N) and kinetoplasts (K) per cell was counted (in 200 cells) at the indicated time points and plotted as a percentage of the total. Each histogram represents mean ± S.D. (n = 3).

