FIGURE 4.
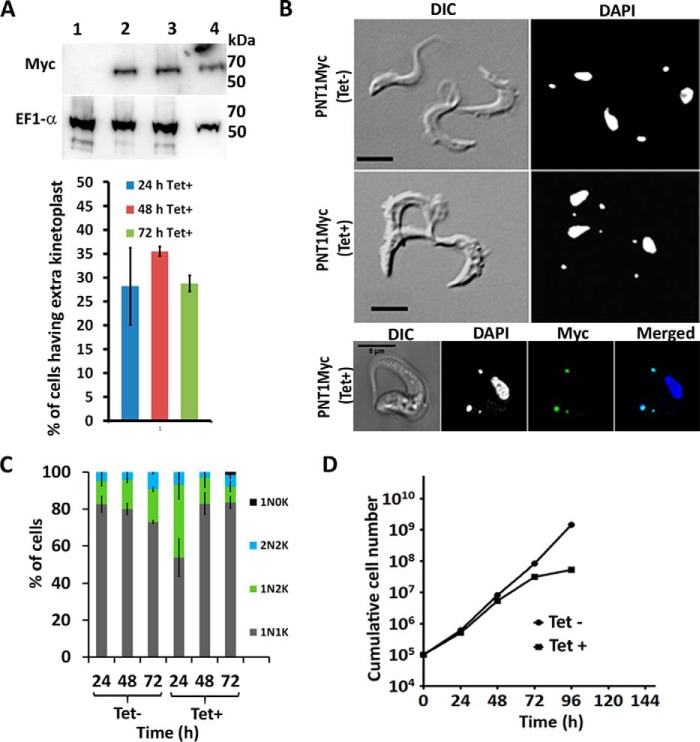
Overexpression of PNT1. A, upper panel, Western blot showing expression of PNT1Myc using anti-Myc antibody at different time points after tetracycline induction (lanes 2–4 represent induced samples after 24, 48, and 72 h, respectively). A 24-h uninduced PNT1Myc sample in lane 1 served as negative control. EF1α was used as the loading control. Lower panel, percentage of cells having anterior kinetoplasts after tetracycline induction at different time points (quantitation from 200 cells, histogram represents mean ± S.D. (n = 3)). B, representative images showing the DAPI-stained, PNT1Myc-tagged cell line before (top panel) and after (middle panel) induction with tetracycline for 24 h. Bottom panel, staining of the PNT1Myc cell line with anti-Myc antibody conjugated to Alexa Fluor 488 (green). Scale bar, 5 μm. C, counts of DAPI-stained kinetoplast (K) and nuclei (N) of the PNT1Myc cell line showing a higher percentage of 1N2K cells at 24 h after induction. The number of 1N2K cells fall after 48 and 72 h (n = 3, mean ± S.D.). D, cumulative growth curve of PNT1Myc cell line showing reduced cell viability after PNT1 overexpression.

