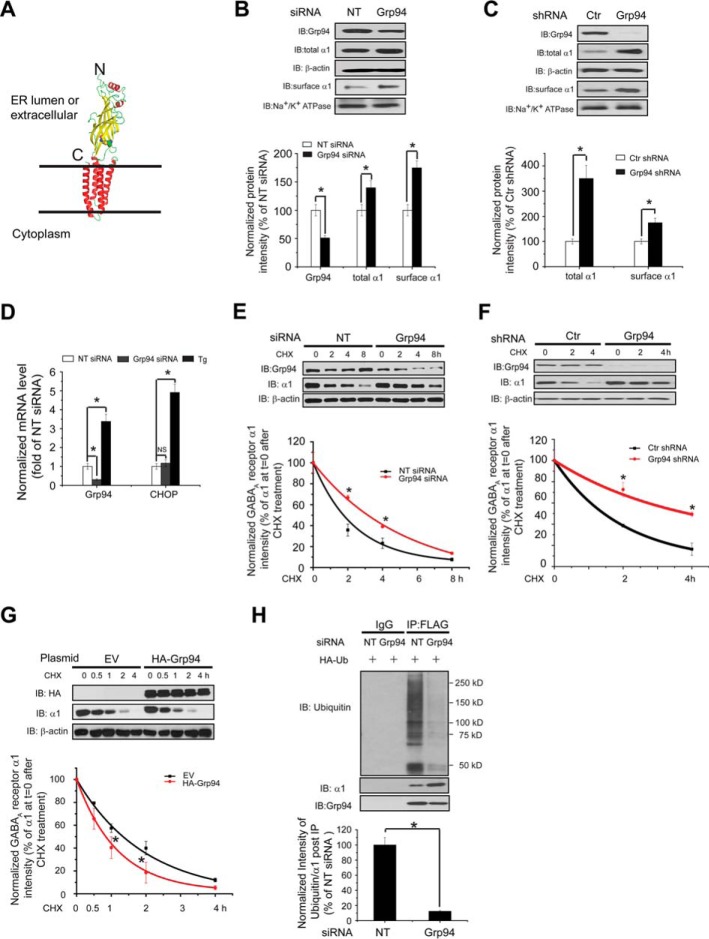
FIGURE 1.
Grp94 positively regulates the ERAD of the α1 subunit of GABAA receptors. A, subunit topology of GABAA receptors. The schematic is built from the crystal structure of the β3 subunit (Protein Data Bank code 4COF). It has a large extracellular (or ER luminal) N terminus, four transmembrane (TM) helices (TM1–TM4), a large intracellular loop connecting TM3 and TM4, and a short extracellular (or ER luminal) C terminus. The two cysteines that form the signature disulfide bond are shown as sphere models. B, knocking down Grp94 increases the total and cell surface protein levels of WT α1 subunits. HEK293 cells stably expressing α1β2γ2 GABAA receptors were transfected with non-targeting (NT) control siRNA or siRNA against Grp94. Forty eight hours post-siRNA transfection, cells were lysed, and the total cell lysates were subjected to SDS-PAGE and immunoblotting (IB) with mouse anti-α1 or rat anti-Grp94 antibodies (n = 3). β-Actin serves as a total protein loading control. Alternatively, the surface α1 subunits were measured using a cell surface protein biotinylation assay (n = 3). The Na+/K+-ATPase α chain serves as a loading control for biotinylated membrane proteins. Protein band quantifications using ImageJ are shown on the bottom panel. C, stably depleting Grp94 increases the total and cell surface protein levels of WT α1 subunits. HEK293T cells stably expressing control (Ctr) or Grp94 shRNA were transiently transfected with WT α1 plasmids together with β2 and γ2 subunit plasmids. Forty eight hours post-transfection, cells were lysed and treated as in B (n = 3). D, Grp94 knockdown does not significantly influence the mRNA level of CHOP by using quantitative RT-PCR analysis. HEK293 cells stably expressing α1β2γ2 GABAA receptors were transfected with non-targeting control siRNA or siRNA against Grp94 for 48 h, or cells were treated with thapsigargin (1 μm, 6 h) as a positive control, which induces CHOP mRNA expression. Then total RNA was extracted from the cells and reverse-transcribed to cDNA before being subjected to quantitative PCR analysis. The experiments were done using two biological replicates in triplicate each time. NS, not significantly. E, knocking down Grp94 increases the half-life of the α1 subunit determined by CHX chase analysis. HEK293 cells stably expressing α1β2γ2 GABAA receptors were transfected with non-targeting control siRNA or siRNA against Grp94 for 48 h and then chased for the indicated time with CHX (100 μg/ml), which inhibits protein synthesis. Cells were lysed and subjected to SDS-PAGE and immunoblotting analysis (n = 3). Degradation kinetics was plotted by quantifying α1 intensity against time after CHX addition on the bottom panel. F, stably depleting Grp94 increases the half-life of the α1 subunit determined by CHX chase analysis. HEK293T cells stably expressing control (Ctr) or Grp94 shRNA were transiently transfected with WT α1 plasmids together with β2 and γ2 subunit plasmids for 48 h and then chased for the indicated time with CHX (100 μg/ml). Cells were then treated as in E (n = 3). G, overexpression of HA-tagged Grp94 decreases the half-life of the α1 subunit determined by CHX chase analysis. HEK293 cells stably expressing α1β2γ2 GABAA receptors were transfected with empty vector (EV) controls or HA-tagged Grp94 plasmids for 48 h and then chased with CHX (100 μg/ml) for the indicated time (n = 3). H, Grp94 knockdown decreases the relative ubiquitination level of α1 subunits. HEK293 cells stably expressing (FLAG-α1)β2γ2 GABAA receptors were transfected with an HA-tagged ubiquitin plasmid together with non-targeting control siRNA or siRNA against Grp94 for 48 h. Total cell lysates were then immunoprecipitated with anti-FLAG M2 magnetic beads before being subjected to SDS-PAGE and blotted for ubiquitin. Quantification of the ratio of ubiquitin/α1 band intensity post-immunoprecipitation, representing the relative ubiquitin level of the α1 subunits, is shown on the bottom (n = 3). IB, immunoblotting. IP, immunoprecipitation. Each data point in B–H is reported as mean ± S.E. *, p < 0.05.

