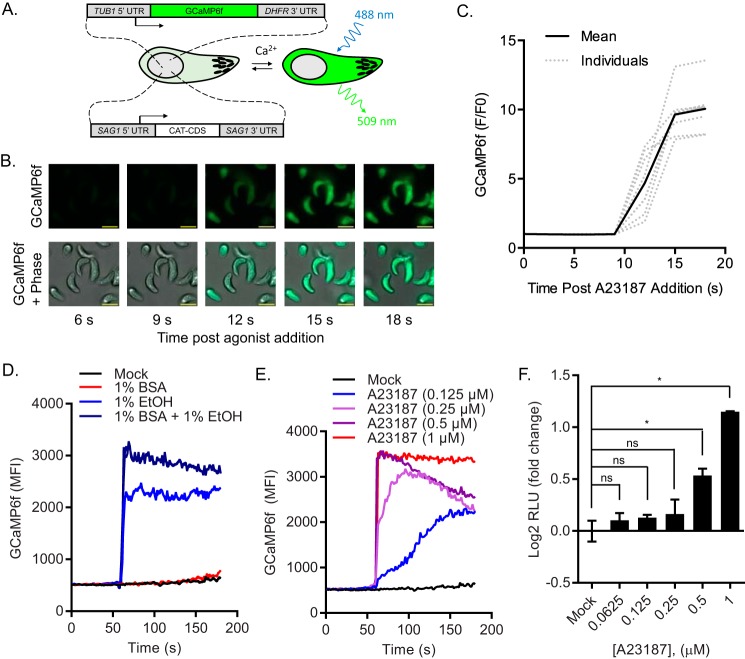
FIGURE 3.
Monitoring intracellular Ca2+ dynamics with GCaMP6f expressing Toxoplasma. A, schematic of transgenic RH-GCaMP6f parasites that express a fluorescent reporter that is sensitive to cytosolic Ca2+ levels. B, time-lapse microscopy of A23187-treated RH-GCaMP6f. RH-GCaMP6f parasites were imaged before and after addition of 2 μm A12387 using bright field phase microscopy and epifluorescence in the GFP channel. Times are indicated in seconds (s). Scale bar = 5 μm. C, quantification of data in B. Fluorescence intensity (F) in the GFP channel was quantified for each parasite in B using ImageJ at each time slice and compared with their initial fluorescence intensity (F0). F/F0 was plotted for each parasite and their mean. D and E, kinetic analysis of intracellular Ca2+ in RH-GCaMP6f parasites. Purified RH-GCaMP6f parasites were treated with secretagogues as indicated and monitored by flow cytometry. Fluorescent output in the FL-1 channel was collected at each second for before and after addition of secretagogues. Traces indicate the mean fluorescent intensities of GCaMP6f versus time and are representative of at least two independent experiments with similar outcomes. F, microneme secretion assay. Purified RH-MIC2-GLuc-C-myc parasites were treated with serial dilutions of A23187 for 10 min at 37 °C and relative MIC2-GLuc-C-myc levels in ESA were determined by luciferase assay. The graph indicates the average and S.D. of duplicate wells for each treatment dilution and is representative of two independent experiments with similar outcomes. *, p ≤ 0.05 versus mock by one-way analysis of variance with Tukey's multiple comparison test. ns, not significant.

