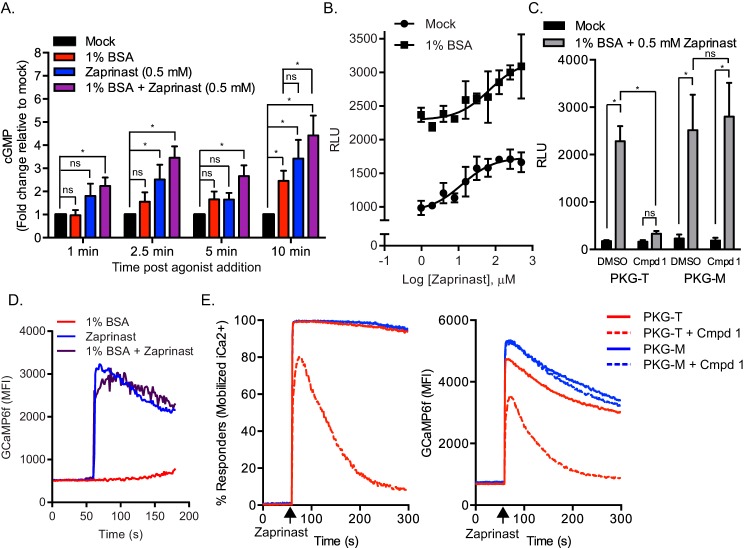
FIGURE 4.
Role of cGMP pathway on stimulated microneme secretion. A, determination of cyclic GMP kinetics in Toxoplasma. Purified RH-MIC2-GLuc parasites were mock-treated or treated with secretagogues for different time intervals at 37 °C and lysates were prepared. Cyclic GMP levels were determined by a competition HRP-linked immunoassay. Relative cGMP levels for each time point were normalized to the mock treated control. The graph indicates the average and S.D. of four independent experiments consisting of duplicate wells for each treatment. *, p ≤ 0.05, two-way analysis of variance with Tukey's multiple comparison test. ns, not significant. B, MIC2-GLuc-C-myc secretion assay. Purified RH-MIC2-GLuc-C-myc parasites were stimulated with serial dilutions of zaprinast alone or in the presence of 1% BSA for 10 min at 37 °C. Relative MIC2-GLuc-C-myc levels in ESA were determined by luciferase assay. The graph indicates the average and S.D. of triplicate wells for each treatment dilution and is representative of two independent experiments. C, MIC2-GLuc-C-myc secretion assay. Transgenic parasites expressing PKG with gatekeeper T or M alleles and expressing the MIC2-GLuc-C-myc reporter were pretreated with 2 μm Compound 1 or vehicle control for 10 min followed by stimulation with the indicated secretagogues. The graph indicates the average and S.D. of duplicate wells for each treatment from four independent experiments with similar outcomes. *, p ≤ 0.05, two-way analysis of variance with Tukey's multiple comparison test. ns, not significant. D, kinetic analysis of intracellular Ca2+ in RH-GCaMP6f. Purified RH-GCaMP6f parasites were treated with secretagogues as indicated and monitored by flow cytometry. Fluorescent output in the FL-1 channel was collected at each second before and after addition of secretagogues. Traces indicate the mean fluorescent intensities of GCaMP6f versus time and are representative of two independent experiments with similar outcomes. E, role of PKG on zaprinast-induced Ca2+. RH-PKGT/M expressing strains expressing GCaMP6f were pre-treated for 10 min with 2 μm Compound 1 or vehicle control and Ca2+ levels were monitored by flow cytometry by acquiring data in the FL-1 channel before and after addition of 0.5 mm zaprinast. Traces from a representative experiment indicate the percent of parasites that mobilized Ca2+ in response to zaprinast (left graph) and the mean fluorescent intensities of GCaMP6f (right graph) versus time.

