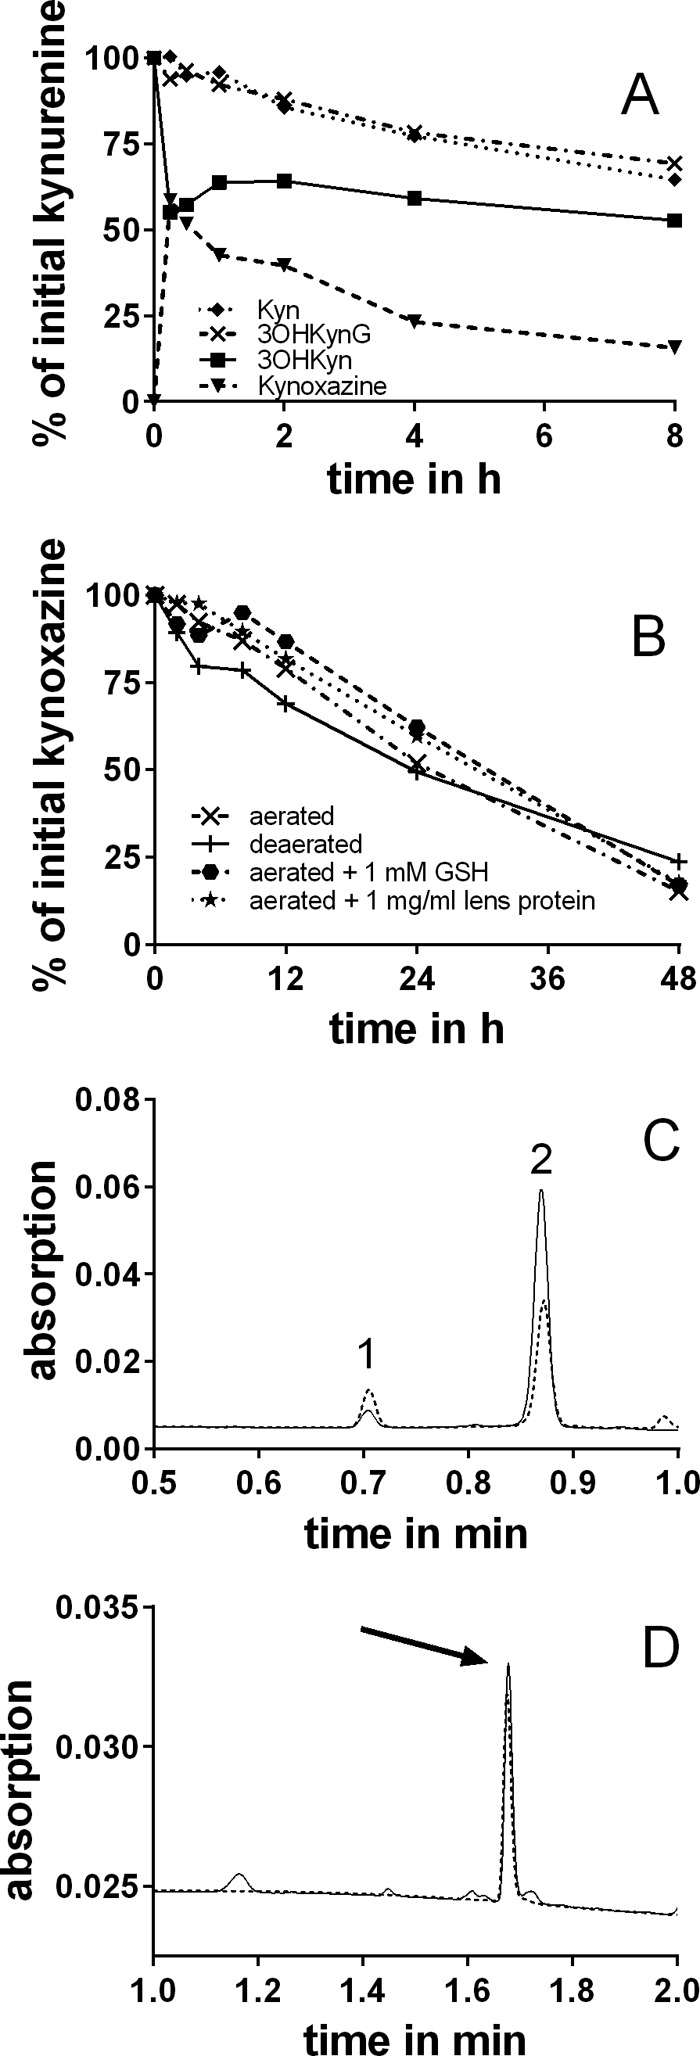
FIGURE 4.

A, reaction of kynurenines with erythrulose and formation of kynoxazine from 3OHKyn and erythrulose in 0.1 m phosphate buffer, pH 7.4. Kynoxazine level is expressed as the peak area of kynoxazine relative to the initial 3OHKyn peak area. B, degradation of kynoxazine in 0.1 m phosphate buffer, pH 7.4, under various conditions. C, UPLC-UV chromatogram of kynoxazine incubations (aerated) at 0 (solid line) and 24 h (dashed line). Peak 1, 3OHKyn; peak 2, kynoxazine. D, UPLC-UV chromatograms of kynoxazine sample (24 h) after derivatization with OPD (solid line) and a 3-DT-Q standard (dashed line, arrow).
