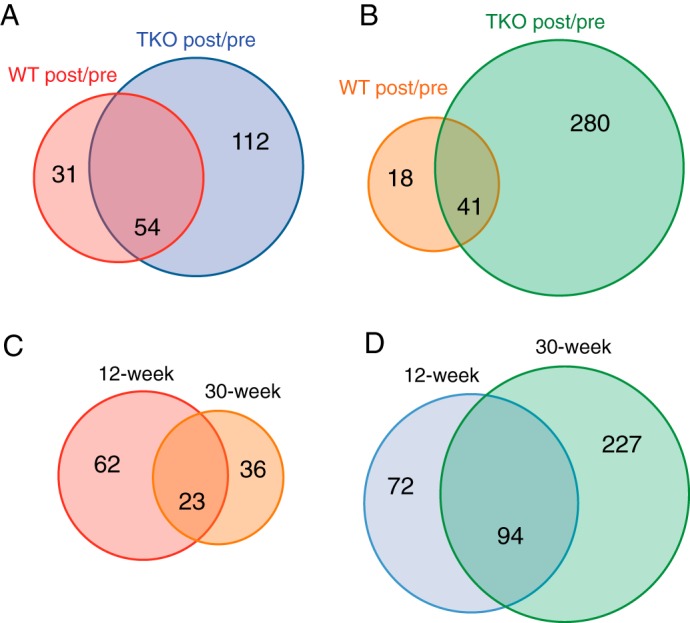
FIGURE 3.

Venn diagrams summarizing the ratios of plasma proteins detected by iTRAQ. A, 12-week-old mice: proteins showing a post-IVGATT/basal ratio ≥2 in WT and TKO mice. B, 30-week-old mice: proteins showing a post-IVGATT/basal ratio ≥2 in WT and TKO mice. C, WT mice: proteins showing a post-IVGATT/basal ratio ≥2 at 12 and 30 weeks of age. D, TKO mice: proteins showing a post-IVGATT/basal ratio ≥2 at 12 and 30 weeks of age. p < 0.05 by ANOVA in all experiments.
