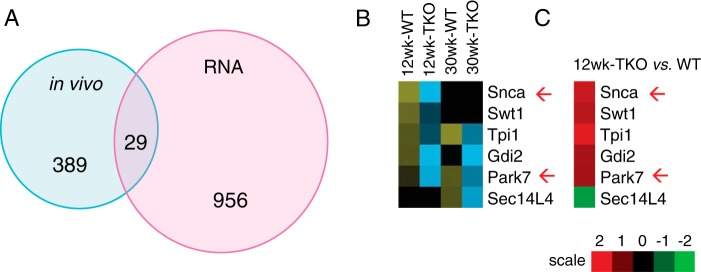
FIGURE 6.
Comparison of in vivo plasma proteins and islet transcriptome. A, Venn diagrams summarizing significantly changed proteins identified in vivo and differentially expressed mRNAs detected in RNA profiling studies of purified islets. p < 0.05 by ANOVA in all experiments. B, heat map of proteins detected in the overlap of the Venn diagrams in B showing proteins that increased in WT mice, and failed to increase in TKO mice. C, heat map of mRNA expression corresponding to the proteins shown in B. Red arrows indicate proteins involved in Parkinson disease.

