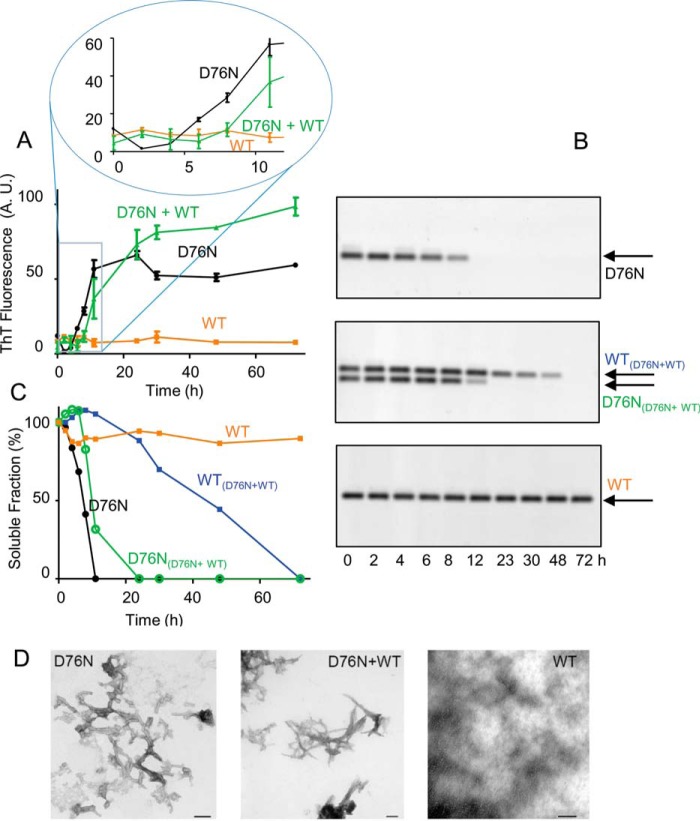
FIGURE 1.
Fibrillogenesis of D76N and WT β2m. A, the time course of aggregation of D76N β2m, WT β2m, equimolar mixture of D76N β2m and WT β2m under stirring conditions, at 37 °C, was monitored by ThT fluorescence emission with excitation and emission wavelengths at 445 and 480 nm, respectively. Inset, expanded view of the ThT signal between 0 and 12 h. B, agarose gel electrophoresis analysis of supernatants from fibrillogenesis samples as described above. The arrows show the electrophoretic mobility of each isoform. C, density of agarose gel bands were measured and plotted as soluble fractions with time. Values shown in A and C are mean ± S.D. (error bars) from three independent experiments. D, negatively stained transmission electron microscopy (scale bar, 100 nm) showing that only WT β2m alone does not form fibrils under physiological conditions and in the absence of D76N β2m seeds.

