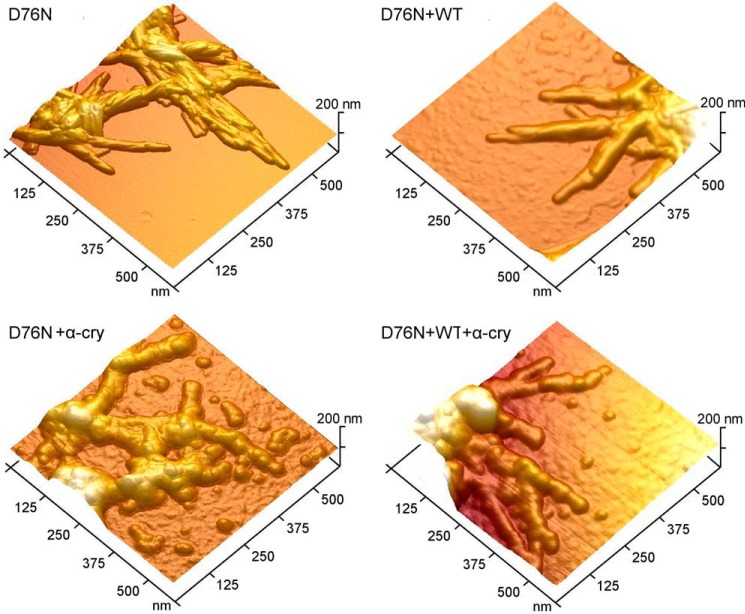
FIGURE 12.
AFM analysis of fibrils and interaction with α-crystallin. Surface plots of topographic AFM images showing fibrillar aggregates formed by D76N β2m alone and by the equimolar mixture of WT and D76N β2m, in the absence (top) and presence (bottom) of α-crystallin (α-cry). Globular structures can be also observed in the upper corner of the image of fibrils by D76N+α-cry or in the background of the image of fibrils by D76N+WT+α-cry.

