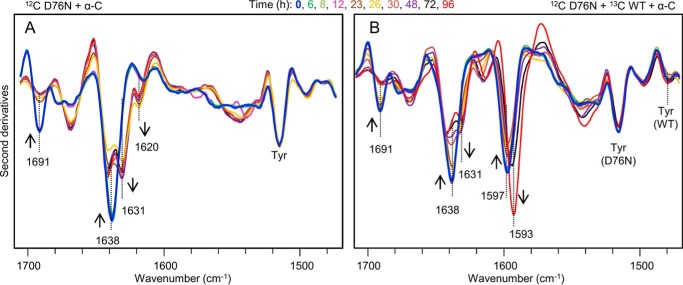
FIGURE 9.
Time course of β2m aggregation in the presence of α-crystallin studied by isotope-edited FTIR spectroscopy. A, second derivatives of absorption spectra of 50 μm [12C]D76N in the presence of 10 μm α-crystallin collected at different times of incubation, 37 °C. B, second derivatives of absorption spectra of an equimolar mixture of the two β2m species in the presence of α-crystallin (50 μm [12C]D76, 50 μm [13C]WT, 10 μm α-crystallin) at different times of incubation, 37 °C.

