FIGURE 4.
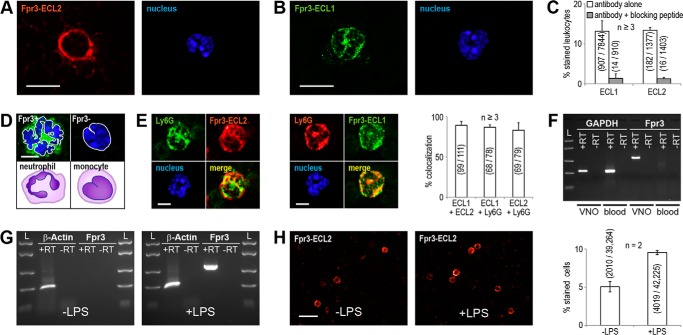
Fpr3 expression in neutrophils is enhanced by LPS stimulation. Representative immunostainings of blood cells from C57Bl/6NCrl mice with the monoclonal mouse antibody Fpr3-ECL2 (A) or the polyclonal rabbit antibody Fpr3-ECL1 (B). For nuclear staining Hoechst33342 was used (right). Scale bars, 10 μm. C, quantification and specificity of Fpr3-ECL2 and Fpr3-ECL1 immunoreactivity in leukocytes. Antibody specificity was demonstrated by blocking the specific binding site through preincubation with 10 μg/ml of the peptide used for antibody generation. D, comparison of nuclear morphologies for Fpr3-positive and -negative leukocytes. Fpr3 was stained with Fpr3-ECL1 (green), and for nuclear staining Hoechst33342 (blue) was used. Fpr3-positive cell (upper left) showing a clearly multiple lobed nucleus, typical for neutrophil granulocytes (lower left). Fpr3-negative cell (upper right) showing a horseshoe-shaped nucleus, typical for monocytes (lower right). Scale bar, 5 μm. E, colocalization between the monoclonal mouse antibody Fpr3-ECL2 (left) and the polyclonal rabbit antibody Fpr3-ECL1 (middle) with the neutrophil marker Ly6G (lymphocyte antigen 6G). Cell nuclei are shown in blue. Scale bar, 5 μm. Right, colocalization between Fpr3 and Ly6G immunoreactivity in leukocytes. Bars show average percentage of colocalizing cells from at least three independent experiments. Numbers in parentheses denote positive versus total cells. Error bars, S.D. F, RT-PCR analysis of Fpr3 expression in mouse blood. Fpr3 expression was only detected in the positive control reaction from vomeronasal cDNA. Glyceraldehyde-3-phosphate dehydrogenase (Gapdh, reverse transcription control) could be amplified from vomeronasal and blood cDNA. Similar results were obtained in three independent experiments. Size marker (L) FastRuler Middle Range DNA Ladder. G, RT-PCR analysis of Fpr3 expression in bone marrow. Fpr3 could not be detected from unstimulated mouse bone marrow cDNA (left). Fpr3 expression was observed upon stimulation with 150 μg/ml lipopolysaccharide (LPS) from S. enteriditis (right). Actb (actin, beta) could be amplified from all cDNAs. Similar results were obtained in two independent experiments. H, representative immunostainings for Fpr3 in unstimulated (left) and LPS-stimulated (middle) bone marrow cells from C57Bl/6NCrl mice and their quantification (right). Scale bar, 20 μm. Bar chart shows mean increase of Fpr3-expressing cells upon LPS stimulation from two independent experiments carried out as triplicate. Numbers in parentheses denote positive versus total cells. Error bars, S.D.

