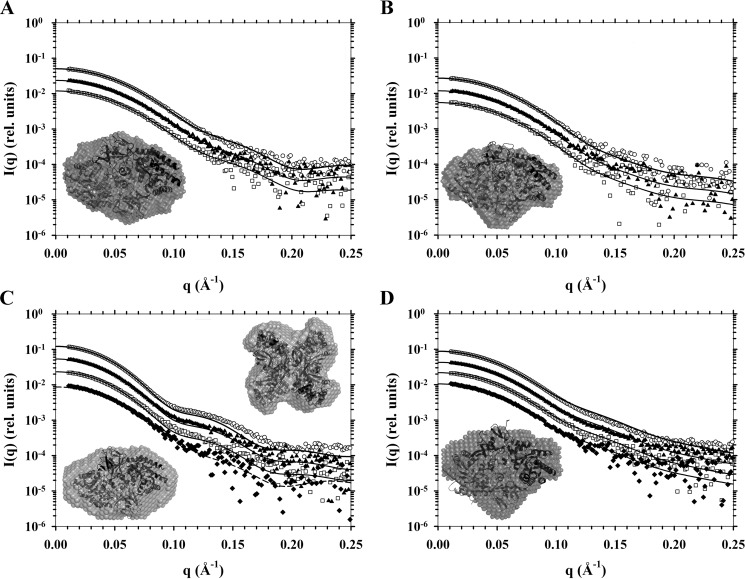
FIGURE 4.
SAXS analyses of DAPDC enzymes. Scattering intensity in relative units is plotted as a function of momentum transfer in Å−1. Buffer corrected scattering data were fitted to theoretical scattering profiles (solid or dashed lines) generated from atomic coordinates from PDB files. Data from highest to lowest concentrations are, respectively, represented by open circles (○), solid triangles (▴), open squares (□), and if so required closed diamonds (♦). Included as insets are DAMMIN ab initio bead models generated from scattering data with overlaid cartoon crystals structures. A, Ba-DAPDC scattering data from 0.84, 0.42, and 0.21 mg ml−1 samples and a DAMMIN bead model fitted to the Mt-DAPDC dimer (PDB code 1HKV). B, Ec-DAPDC scattering data from 0.50, 0.25, and 0.13 mg ml−1 samples and a DAMMIN bead model fitted to the dimer assembly calculated by PISA of the E. coli DAPDC crystal structure (PDB code 1KO0). C, Mt-DAPDC scattering data from 1.40, 0.70, 0.35, and 0.17 mg ml−1 samples and DAMMIN bead models fitted to either its dimer (PDB code 1HKV) or the PISA tetramer assembly generated from the T. maritima DAPDC crystal structure (PDB code 2YXX). Solid lines are fits to the 2YXX tetramer and the dashed line is the fit to the 1HKV dimer. D, Vc-DAPDC scattering data from 1.48, 0.74, 0.37, and 0.19 mg ml−1 samples and a DAMMIN bead model fitted to the dimer of PDB code 3N2B (i.e. chains A and B).

