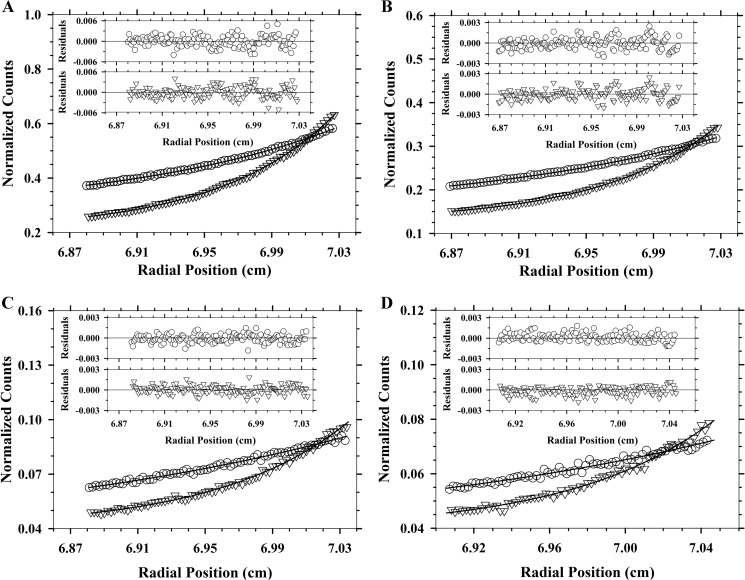
FIGURE 6.
AU-FDS sedimentation equilibrium analysis of Vc-DAPDC. Once sedimentation of samples were at equilibrium at 9,000 (○) and 14,000 (▿) rpm, fluorescence emission readings of Alexa Fluor 488 from 519 nm were collected, corrected for photomultiplier voltage differences, and finally normalized to pseudo-absorbance values (y axes) for use in the program SEDPHAT. Overlaid to the experimental data are the global nonlinear regression best fit to a monomer-dimer self-association model (global reduced χ2 = 0.039). Residuals are displayed above each plot for 9,000 (○) and 14,000 (▿) rpm data. The KD2→1 of 0.061 nm was yielded from experimental Vc-DAPDC concentrations of A, 40; B, 20; C, 4; and D, 2 nm.

