FIGURE 8.
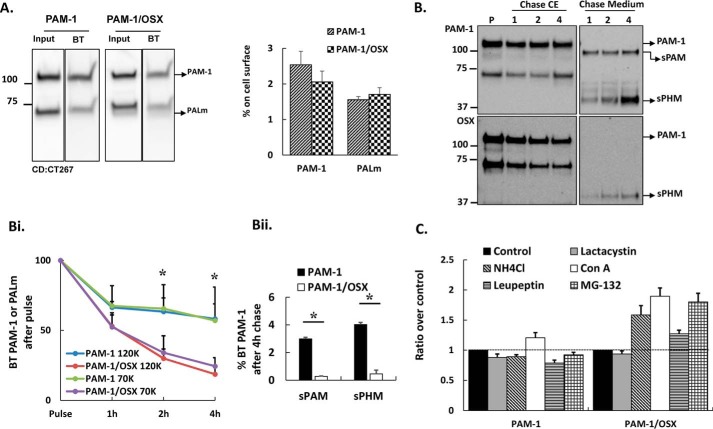
Internalized PAM-1/OSX is degraded more rapidly than internalized PAM-1. A, biotinylated proteins were isolated from PAM-1 and PAM-1/OSX AtT-20 cells exposed to cell-impermeant activated biotin for 10 min at 4 °C. Input and biotinylated proteins (BT) fractionated by SDS-PAGE were visualized using a C-terminal antibody. Input lanes contained 5% as much sample as biotinylated lanes. Data for PAM-1 and PALm from two separate experiments were quantified. B, cells exposed to cell impermeant-activated biotin for 10 min at 37 °C were analyzed immediately (pulse, P) or chased for 1, 2, or 4 h. Biotinylated proteins isolated from cell extracts (CE) and chase media were fractionated and probed for PAM using an exon 16 antibody. Arrows indicate products produced from biotinylated PAM-1. B, panel i, line graph shows biotinylated PAM-1 and PALm recovered at each chase point plotted as % biotinylated PAM-1 or PALm after the pulse (*, p < 0.05; PAM-1 and PALm, n = 3). B, panel ii, biotinylated sPAM and sPHM recovered from the media after the 4-h chase are plotted as % biotinylated PAM-1 after the pulse. Values are averages of two experiments with duplicate samples. C, PAM-1 or PAM-1/OSX AtT-20 cells were treated with vehicle (Control) or other pharmacological agents to inactivate proteases; PAM-1 in cell lysates was visualized using the PHM antibody. Non-saturated images were quantified; each bar represents the mean from two experiments performed in triplicate ± S.D. Con A, concanamycin A.

