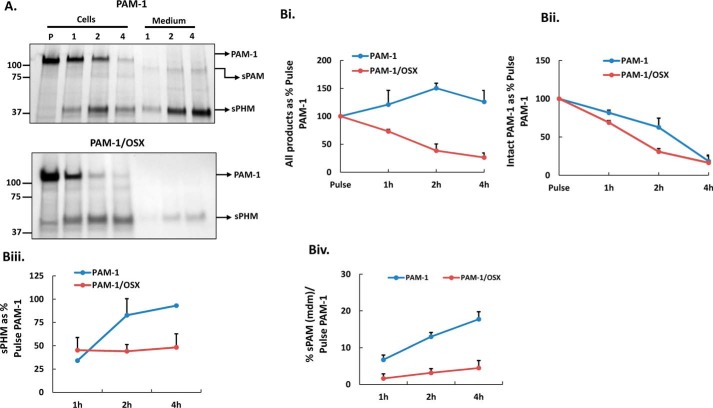
FIGURE 9.
Biosynthetic labeling demonstrates extensive degradation of PAM-1/OSX. A, AtT-20 cells expressing PAM-1 or PAM-1/OSX were incubated with [35S]Met/[35S]Cys for 30 min and either harvested immediately (pulse, P) or chased for 1, 2, or 4 h; aliquots representing 1/3rd of each cell extract or medium sample were immunoprecipitated with a PHM antibody. Immunoprecipitates were fractionated by SDS-PAGE and visualized by fluorography; major PAM products are indicated by arrows on the right. Data for PAM-1, sPAM, and sPHM in cell extracts and media were quantified using films exposed for different times; the amount of PAM-1 or PAM-1/OSX present after the pulse was taken as 100%. B, panel i, total recovery of intact PAM-1 (B, panel ii) and sPHM (B, panel iii) was calculated by taking 120-kDa PAM present after the pulse as 100%. B, panel iv, secretion of newly synthesized sPAM was plotted as a percent of pulse PAM-1 at each chase point in both cell types. Graphs were constructed from mean values of two independent experiments.

