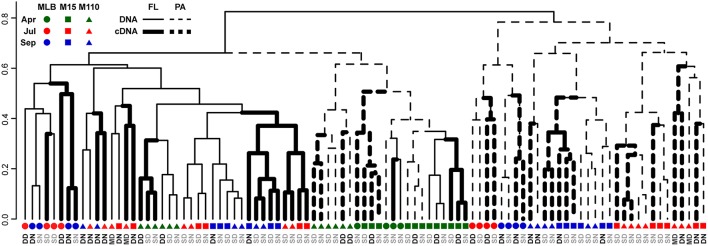
Figure 2.
Dendrogram reflecting similarity between DNA and RNA level bacterial community composition. UPGMA hierarchical clustering based on abundance-weighted bacterial community dissimilarity (Bray-Curtis). Community composition data included the 2211 OTUs retained after replicate sample merging (averaging with rounding down) and scaling of the data to the smallest dataset size. Letter colors discriminate surface (gray) from deep and chlorophyll maximum (black) water samples: DN, Deep, nighttime; DD, Deep, daytime; SN, Surface, nighttime; SD, Surface, daytime; MD, Chlorophyll maximum, daytime.

