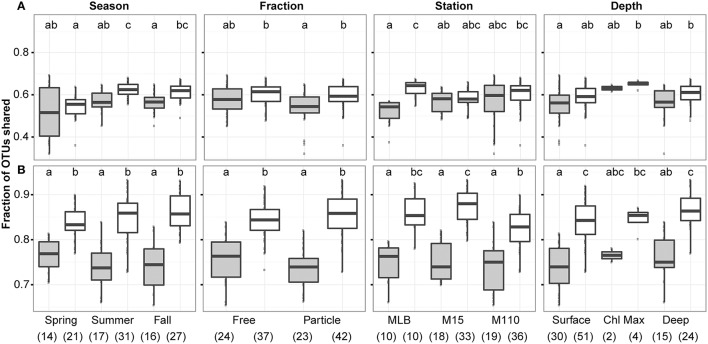
Figure 3.
Overlap of observed OTUs between samples in function of season, filter fraction, station, and depth. Boxplots show overlap between RNA and DNA level data (gray) in contrast to the overlap between replicate samples (both DNA and RNA data; white). Analysis was performed using (A) 2211 OTUs retained after replicate sample merging and scaling to the smallest dataset size and (B) the top 200 most abundant OTUs across. In each panel, letter(s) above boxplots differentiate sample groups that are significantly different in their degree of OTU overlap (i.e., categories with significantly different OTU overlap do not share any letters), as determined by pair-wise post-hoc testing of the Kruskall-Wallis non-parametric one-way ANOVA test results. Numbers in parentheses below the x-axis labels represent the number of comparisons included for each sample grouping. Comparisons always excluded self-comparisons.

