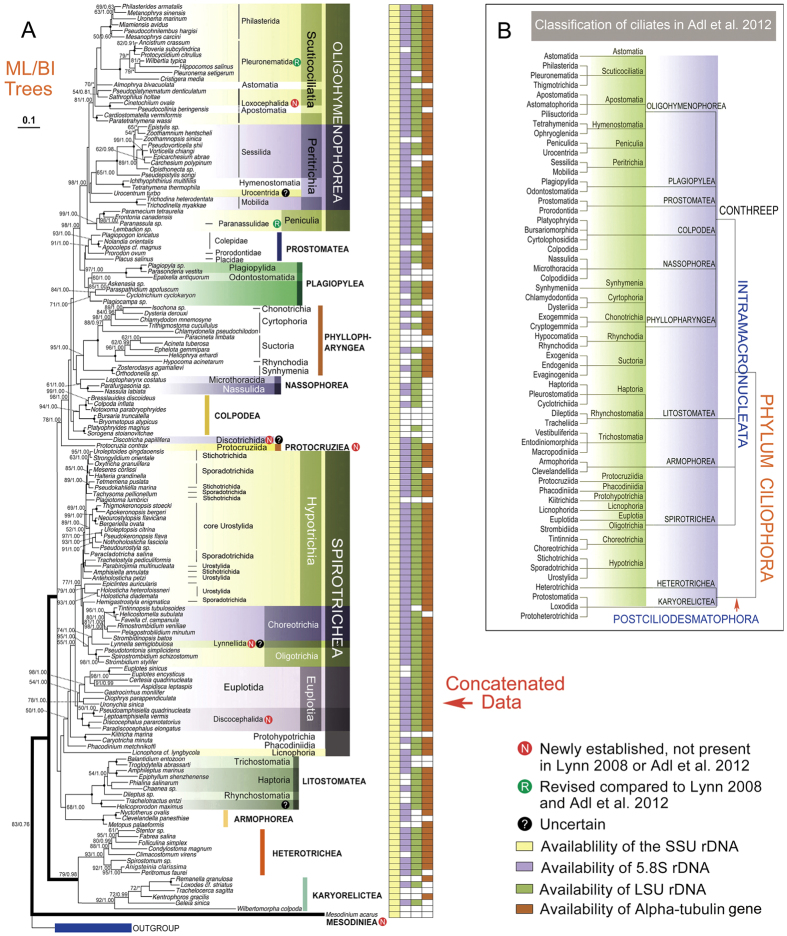
Figure 1.
Phylogenetic tree (A) and classification (B) of the phylum Ciliophora. (A) Maximum likelihood (ML) tree reconstructed using 152 ciliates and concatenated genes (the SSU rDNA sequence is available for all the taxa whereas the 5.8S rDNA, LSU rDNA and alpha-tubulin gene sequences are available for only a subset of these taxa, Additional file 1: Table S2). Numbers at nodes represent the bootstrap values of maximum likelihood (ML) out of 1000 replicates and the posterior probability of Bayesian analysis (BI). Only bootstraps above 50% are shown. Fully supported (100%/1.00) branches are marked with solid circles. Asterisk (*) indicates disagreement between ML and BI analyses. The three main branches of ciliates are in bold. The scale bar corresponds to 10 substitutions per 100 nucleotide positions. (B) Classification scheme of phylum Ciliophora according to Lynn5 and Adl et al.44.

