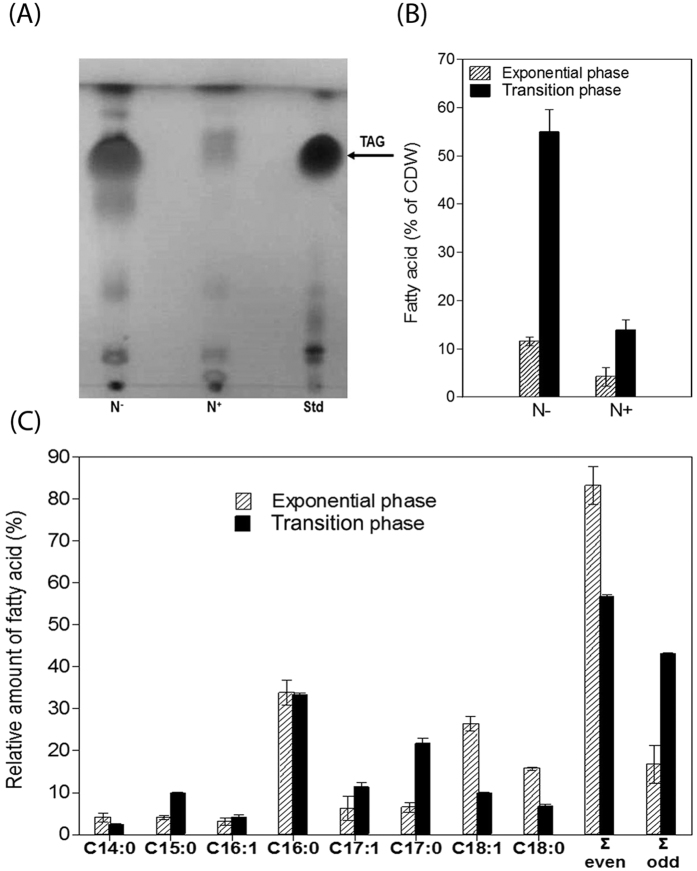
Figure 2. Lipid analysis of whole-cell extracts of benzoate-grown RHA1 under different nitrogen conditions.
(A) TLC. Lanes: Std, TAG standard; N−, N-limiting condition; N+, N-excess condition during transition phase. (B) Total amounts of FAs (% of cellular dry weight) during exponential growth and transition phase under N-limiting (N−) or N-excess (N+) conditions. (C) FA composition of lipid accumulated by RHA1 under N-limitation during exponential growth and transition phase. Total FAs and relative amounts of each were measured by GC-MS. The data represent the means of three biological replicates.

