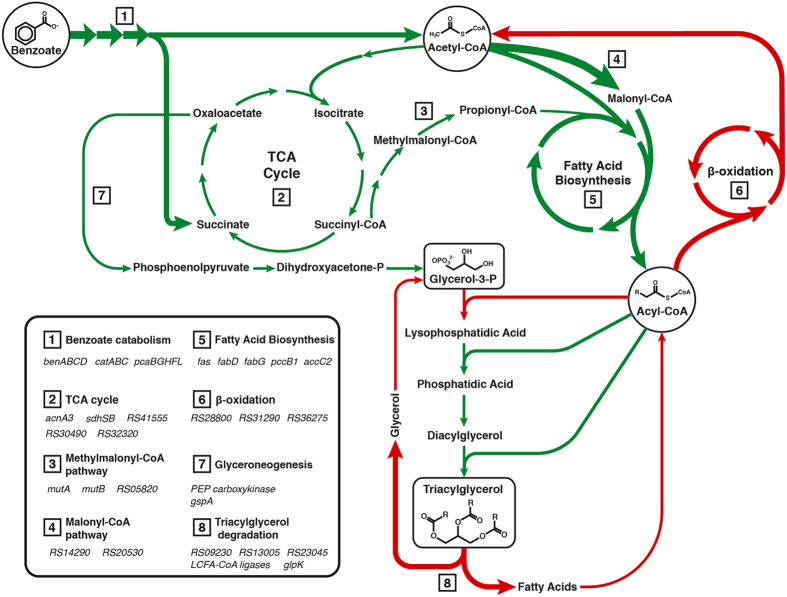
Figure 3. Overview of pathways related to TAG biosynthesis and transcript levels during the transition to stationary phase under N-limitation.
. Relevant genes are listed in the lower left chart. Arrows are colored as follows: green, transcripts of genes more abundant during N-limited transition; red, transcripts of genes less abundant during N-limited transition. Arrow thickness represents fold change: narrow, 2–10-times; regular, 10–100-times; wide, >100-times. Pyruvate was not explicitly included as a central metabolite for clarity. For the Kennedy pathway, the average RPKM values of the homologs listed in Fig. 1 were summed. For the TAG lipase step, the values of the three annotated homologs (listed as RS numbers under TAG degradation) were summed.

