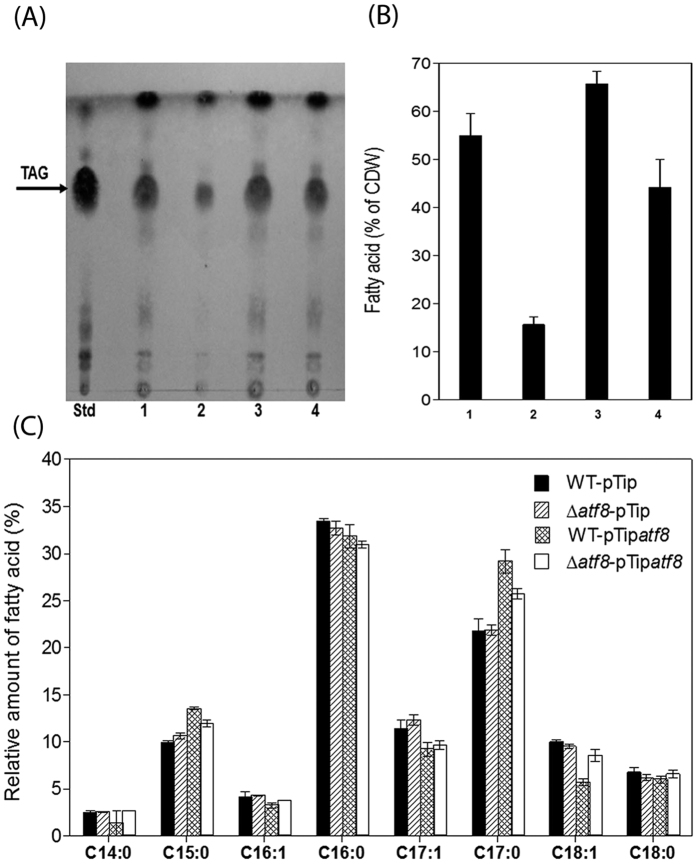
Figure 5. Lipid analysis of whole-cell extracts of benzoate-grown atf8-manipulated strains during transition phase under N-limitation.
(A) TLC. Lanes: Std, TAG standard; 1, WT:pTip; 2, Δatf8:pTip; 3, WT:pTipatf8; and 4, Δatf8:pTipatf8. (B) Total amounts of fatty acids measured by GC-MS. Lanes numbered as in (A). (C) FA composition of RHA1 strains. Total amount of FA and the relative proportions of each type are presented as in Fig. 2. The data represent the means of three biological replicates.

