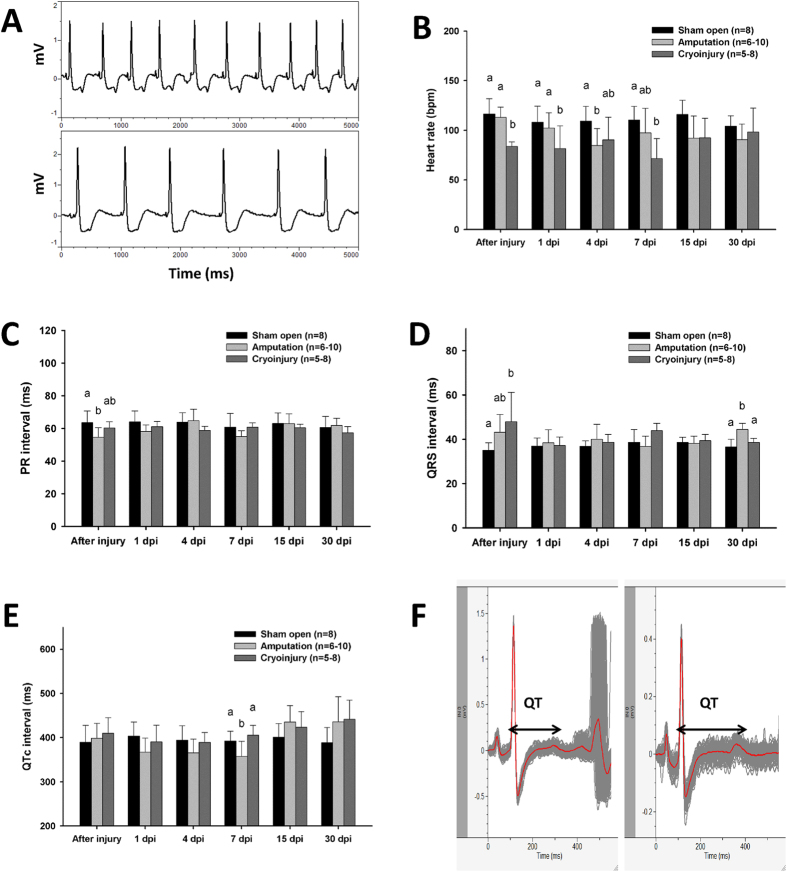
Figure 5. ECG of heart injury models in zebrafish.
(A) ST segment depression and inverted T wave in amputation (upper) and cryoinjury (lower) model immediately following injury. (B) Heart rate, (C) PR interval, (D) QRS interval, and (E) QTc interval of sham control and two injury models during regeneration. Values are presented as the mean + SD, different letters indicate means that are significantly different (Tukey’s test, p < 0.05). (F) ECG waveform of 30 days post-cryoinjury zebrafish with prolonged QT interval (right) compared with sham open control (left).

