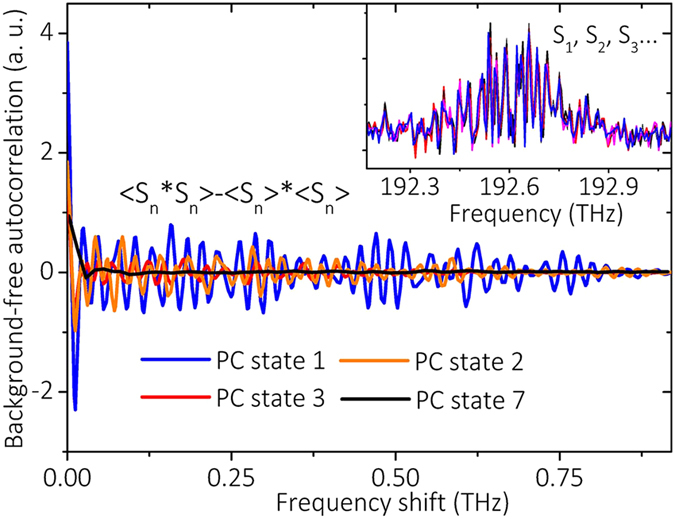
Figure 4. Autocorrelation analysis of the first Stokes region in single-shot spectra for different PC states.

The inset contains 5 consecutive single-shot spectra within the first Stokes region (shaded region in Fig. 3(c)) under PC state 2, where only small fluctuations are shown.
