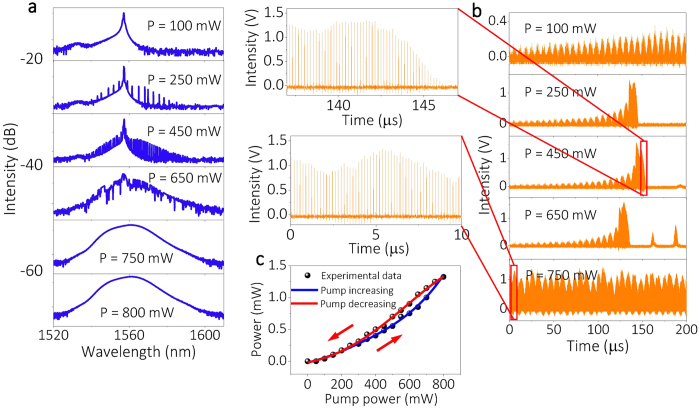
Figure 5. Evolution of PML as the pump strength is varied.
(a) Averaged optical spectra for different pump power levels. (b) Corresponding temporal traces detected by PD1. The insets illustrate the cavity output over a smaller time range. (c) Hysteresis effect of average output power under different pumping regimes (increasing vs. decreasing pump power).

