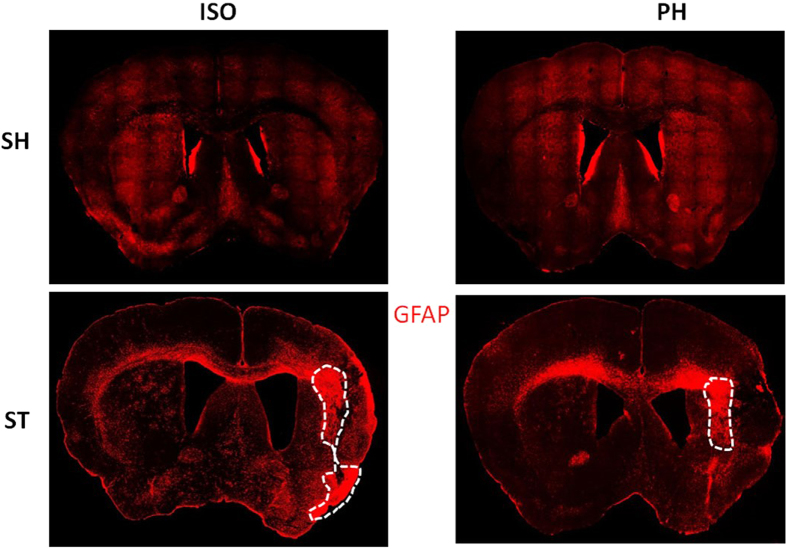
Figure 7. A representative mosaic image of a mouse brain section (10 × magnifications) for GFAP expression 4 weeks after MCAO.
Immunostaining with GFAP (red) showed that GFAP + cells were activated at the site of infarction in both stroke groups. Dotted lines show that dense GFAP expression (the glial scar) was confined to the striatal region in ST-PH mice while it was larger and spread to both the striatum and cortex (n = 4 per group) in ST-ISO mice.

