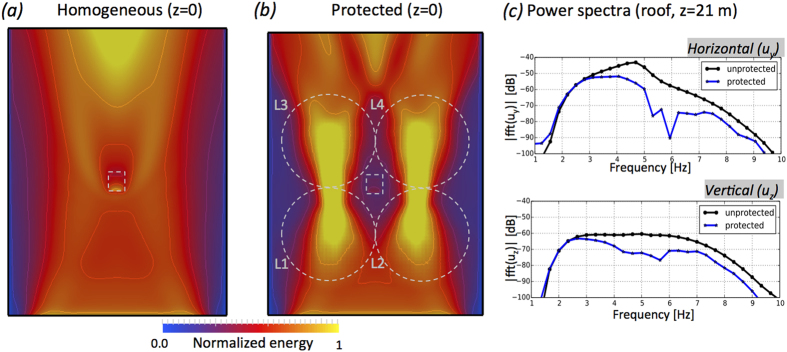
Figure 3.
(a) Maps of the elastic energy distribution at the surface (z = 0) for the homogenous case. Same as (b) but for the lenses case. (c) Spectral density of the rooftop motion of the building in dB. In the upper panel, the blue trace is calculated for the homogeneous case while the black is obtained when the lenses enclose the building. The lower panel is identical, but now for the vertical component.

