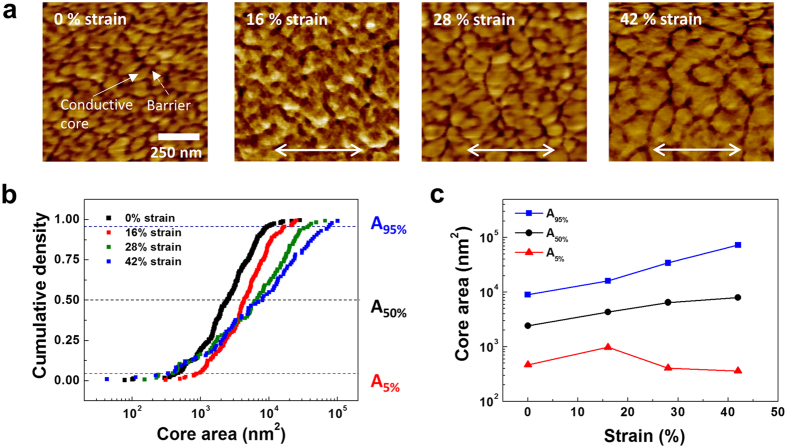
Figure 2. Morphological change of PEDOT:PSS according to the applied tensile strain.
(a) AFM phase images of PEDOT:PSS films at each strain denoted in the images. Bright and dark fields represent the PEDOT-rich cores and the PSS shells, respectively. The arrow indicates the stretching direction, and all the images were obtained by using tapping-mode AFM at a scale of 1 × 1 μm2. (b) Distribution of cumulative density as a function of PEDOT-rich core area by using log-normal distribution function. (c) The change in the area PEDOT-rich cores at 5%, 50%, and 95% of cumulative density as function of tensile strain.

