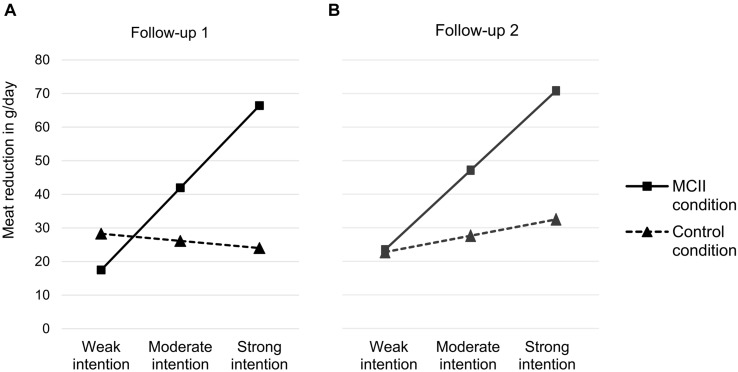
FIGURE 1.
Simple slopes for intention to reduce meat consumption differentiated for intervention condition (control vs. MCII) in the 1st week (A) and 4th week (B) after the intervention. Meat reduction values of this display were calculated for weak intention (M - 1 SD), moderate intention (M) and strong intention (M + 1 SD). MCII, mental contrasting with implementation intentions.

