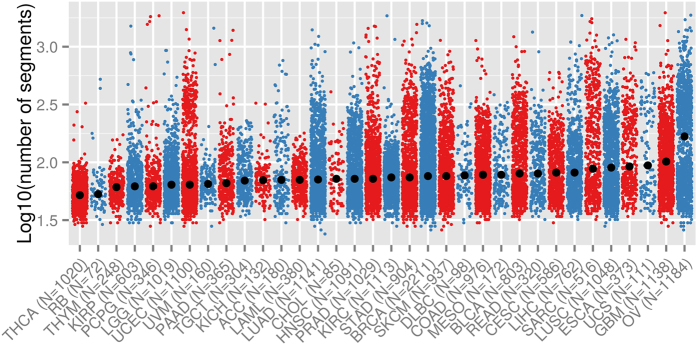
Figure 5. Number of SCNAs across different cancer types.
For each tumor (dots) the number of contiguous DNA segments (so wild type is 22 + X + Y = 24 segments, log10(24) = 0.38) is plotted for our retinoblastoma cohort and all cancer types available at TCGA in alternating colors. Cancer types are ordered by increasing median of SCNAs, showing that the retinoblastoma genome has relatively few SCNAs compared with cancers available in TCGA.

