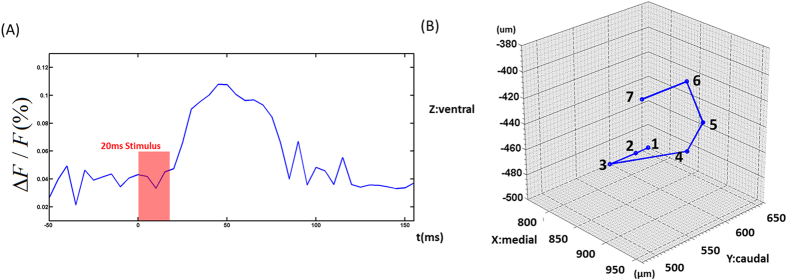
Figure 4.
(A) Change in fluorescence (ΔF/F(%), ordinate) in response to the C2 whisker stimulation. Fluorescence signal was calculated from the ROI (green cubic box: 3 × 3 × 3 pixels) shown in Fig. 3 at 50 ms post-stimulation. (B) Coordinates of the strongest change in fluorescence (ΔF/F(%), ordinate) in response to the C2 whisker stimulation. 1:30 ms and 35 ms (760 μm, 660 μm, −500 μm); 2:40 ms (760 μm, 640 μm, −500 μm); 3:45 ms (760 μm, 600 μm, −500 μm); 4:50 ms (940 μm, 560 μm, −440 μm); 5:55 ms (900 μm, 620 μm, −440 μm); 6:60 ms and 65 ms (960 μm, 540 μm, −380 μm); 7:70 ms (960 μm, 480 μm, −380 μm).

