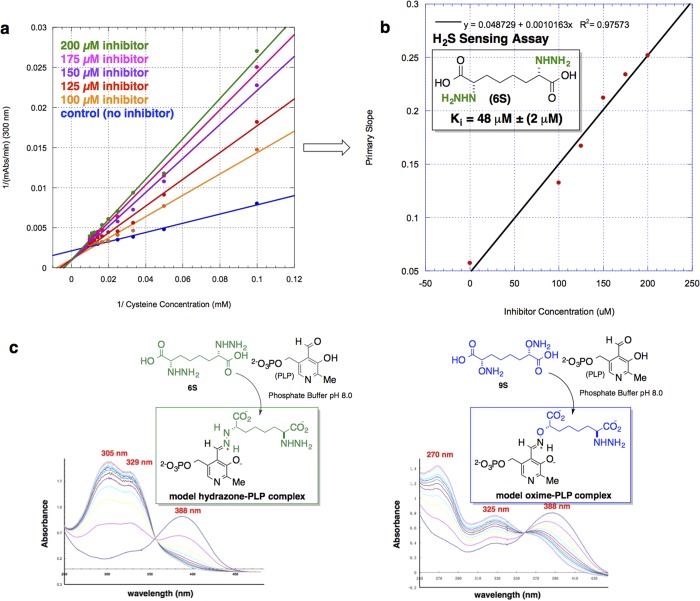
Figure 3.
Results from kinetic analysis of inhibitor candidates with the hCBS truncated dimer. (a) Lineweaver–Burk plot for hCBS inhibition with 6S, detecting H2S production in the presence Pb(OAc)2. (b) Secondary-plot of bis-α-hydrazino acid (6S) inhibition of H2S production by hCBS yielding a Ki value of 48 ± 2 μM. (c) UV/vis spectroscopic profile of model PLP-inhibitor adducts formed nonenzymatically. Conditions: 0.26 mM hydrazino acid 6S, 0.2 mM PLP, 50 mM KPO4 (pH 8.0), scans every 10 min, isosbestic point = 355 nm, t1/2 = 7 min (left spectrum); conditions: 0.33 mM aminooxy acid 9S, 0.2 mM PLP, 50 mM KPO4 (pH 8.0), scans recorded every 10 min, isosbestic point = 360 nm, t1/2 = 15 min (right spectrum).

