Figure 6.

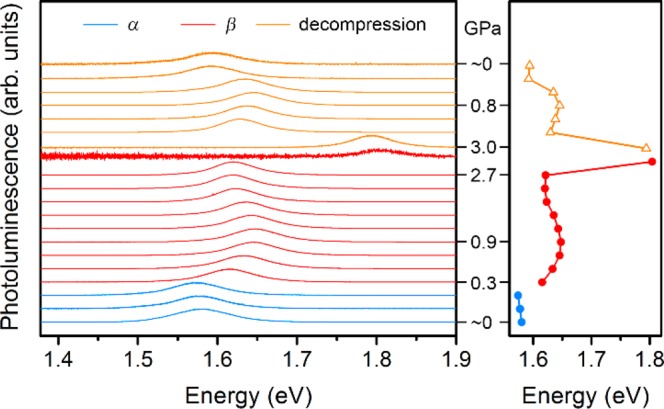
Left: Normalized photoluminescence (PL) spectra for a single crystal of (MA)PbI3 as a function of pressure. Right: Pressure response of the PL peak energy.

Left: Normalized photoluminescence (PL) spectra for a single crystal of (MA)PbI3 as a function of pressure. Right: Pressure response of the PL peak energy.