Figure 9.

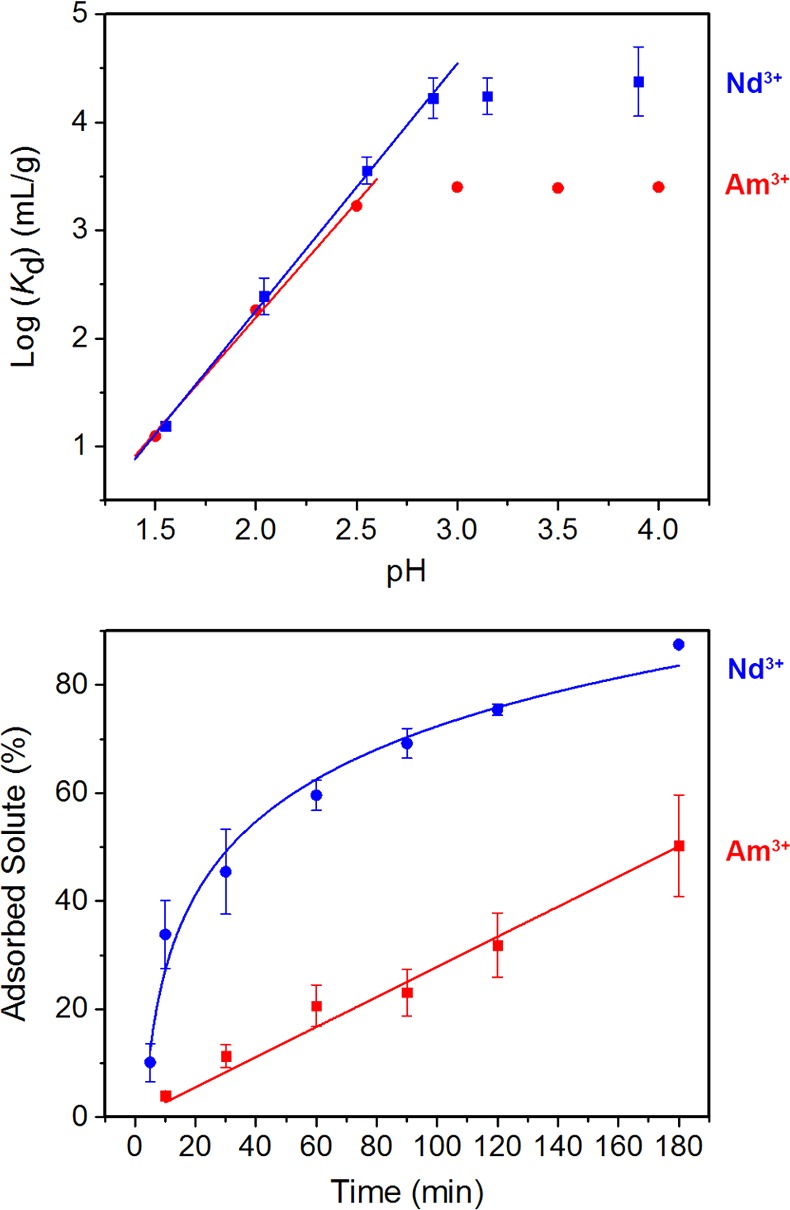
A plot of the log(Kd) versus measured pH for aqueous solutions containing Nd3+ and Am3+ ions (top), and kinetics for the uptake of Nd3+ and Am3+ (bottom).

A plot of the log(Kd) versus measured pH for aqueous solutions containing Nd3+ and Am3+ ions (top), and kinetics for the uptake of Nd3+ and Am3+ (bottom).