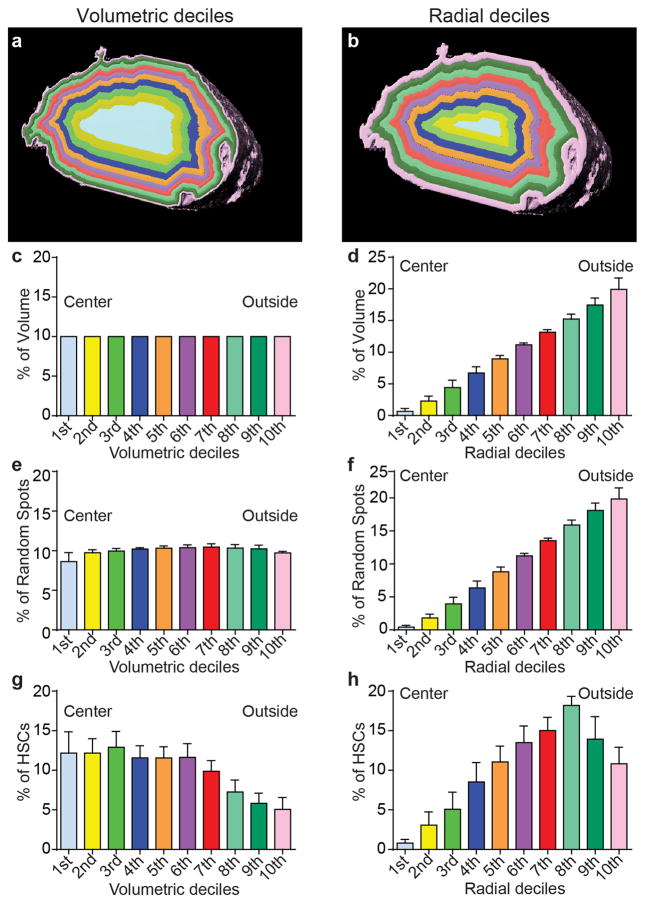
Extended data figure 6. HSCs are enriched in the central marrow and depleted near the endosteum in the diaphysis.
a,b, The distribution of HSCs from the central marrow to the endosteum can be determined by drawing concentric cylinders that correspond to equal volumetric deciles from the center of the marrow to the endosteum (a) or to equal radial deciles from the center to the endosteum (b). c,d, Each volumetric decile (as in a) contains 10% of the marrow volume (c). However, cylinders based on radial deciles (as in b), contain successively larger volumes of marrow as they approach the endosteum because the circumference of the cylinders becomes larger (d). e,f, The distribution of random spots among volumetric deciles (a) is nearly equal because each cylinder contains an equal marrow volume (e). However, the number of random spots per cylinder based on radial deciles (b) increases from the center to the endosteum as cylinder volume increases (f). g, When we plotted our HSC localization data by volumetric deciles (as in Figure 2a), HSC were enriched toward the central marrow. h, When we plotted our HSC localization data by radial deciles, the number of HSCs per cylinder increased toward the endosteum as cylinder volume increased, similar to random spots.

