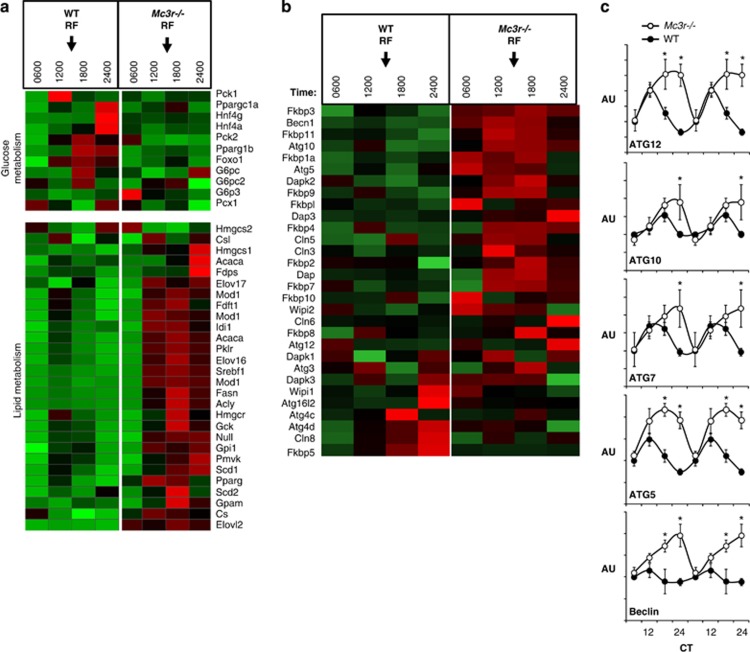
Figure 2.
Heatmap showing the expression of genes involved in glucose and lipid metabolism (a) and autophagy (b); the expression profile of selected genes involved in autophagy was further analysed using quantitative RT–PCR (c). The microarray and RT–PCR used total RNA isolated from the liver of wild-type (WT) and Mc3r−/− mice subjected to restricted feeding (RF); the expression of genes involved in clock activity, carbohydrate metabolism and lipid metabolism using these samples was reported in Sutton et al. (2010).16 Time of feeding is indicated by arrows in a and b; mice were presented food daily at 1300 h for 7 days. On the day of tissue collection, mice were not provided with food and they were euthanized at the times indicated. Insulin stimulates lipogenesis via increasing the activity of the transcription factor SREBP1,93 and the increased expression levels of SREBP1a and 1c correlate with increases in serum insulin levels in Mc3r−/− mice for the 1200-, 1800- and 2400-h time points reported previously.16 The results shown in b suggest that the amplitude of rhythms in the expression of genes involved in autophagy, which are under the control of clock genes,94 is also amplified in Mc3r−/− mice subjected to RF. *P<0.05 vs wild type.

