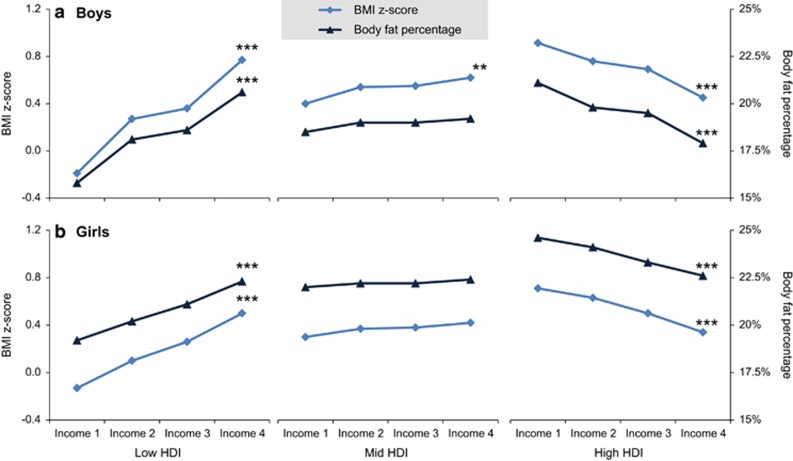
Figure 2.
Income gradients in adiposity measures across HDI levels in boys (a) and girls (b). Data are shown as least-square means at HDI levels corresponding to the 10th, 50th and 90th percentiles of the ISCOLE sample (HDI=0.52, 0.72 and 0.91, respectively). Tests for linear trend are indicated: **P<0.001; ***P<0.0001.

