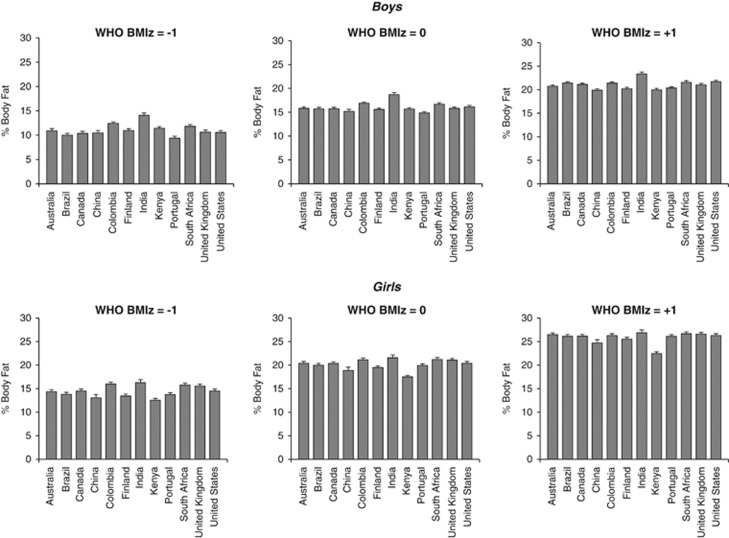
Figure 1.
Levels of percentage body fat (PBF) at WHO BMIz values of −1, 0 and 1 in 7265 (a) boys and (b) girls from the International Study of Childhood Obesity, Lifestyle and the Environment (ISCOLE). Error bars represent s.e. WHO BMIz computed from reference data from the World Health Organization.9 Significant differences in boys: at WHO BMIz=−1: Colombia>Canada, China, Portugal; India>Canada, China, Finland, Kenya, Portugal, South Africa, the United Kingdom and the United States; Portugal<Colombia, Kenya, India and South Africa; at WHO BMIz=0: Colombia>China, Finland and Portugal; India>Australia, Brazil, Canada, China, Colombia, Finland, Kenya, Portugal, the United Kingdom and the United States; Portugal<South Africa, Colombia and India; at WHO BMIz=+1: Colombia>Kenya; India>Australia, Brazil, Canada, China, Colombia, Finland, Kenya, Portugal and the United Kingdom; the United States>China, Finland, Portugal and Kenya; Brazil>Kenya. Significant differences in girls: at WHO BMIz=−1: Kenya<Canada, Colombia, India, South Africa, the United Kingdom and the United States; Colombia>Brazil, China, Finland, Kenya, and Portugal; Finland<Colombia, India, South Africa and the United Kingdom; India>China and Finland; South Africa>Kenya, Finland and Portugal; at WHO BMIz=0: Kenya<Australia, Brazil, Canada, Colombia, Finland, India, Portugal, South Africa and the United States; at WHO BMIz=+1: Kenya<Australia, Brazil, Canada, Colombia, Finland, India, Portugal, South Africa, the United Kingdom and the United States.

