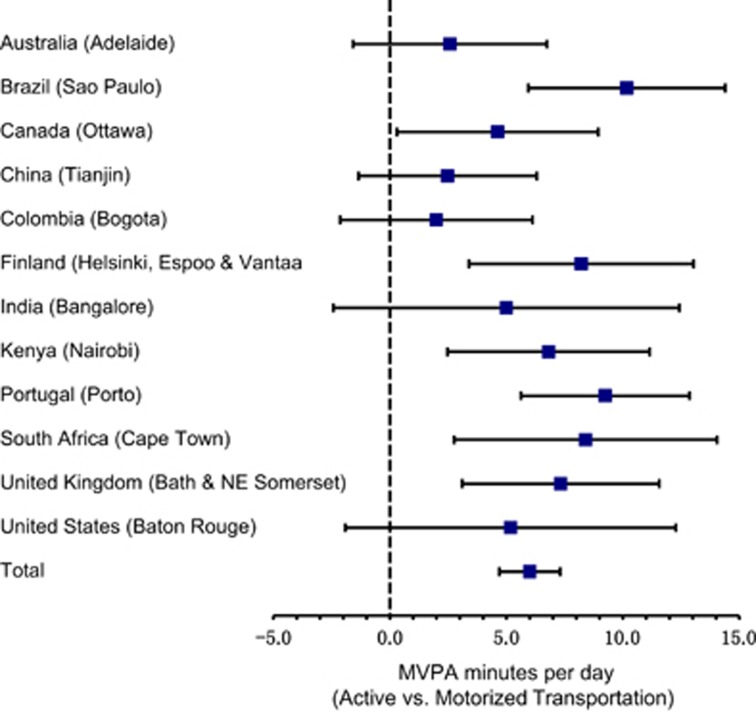
Figure 1.
The difference in mean school day MVPA among children who engage in AST compared with motorized transport to school in n=6224 9–11-year-old children. Means are adjusted for sex, BMI z-score, age, highest parental educational attainment, accelerometer waking wear time, site by AST interaction and school nested within site was treated as a fixed effect in the multilevel analysis. Error bars represent 95% confidence intervals.

