
Fig. 1.
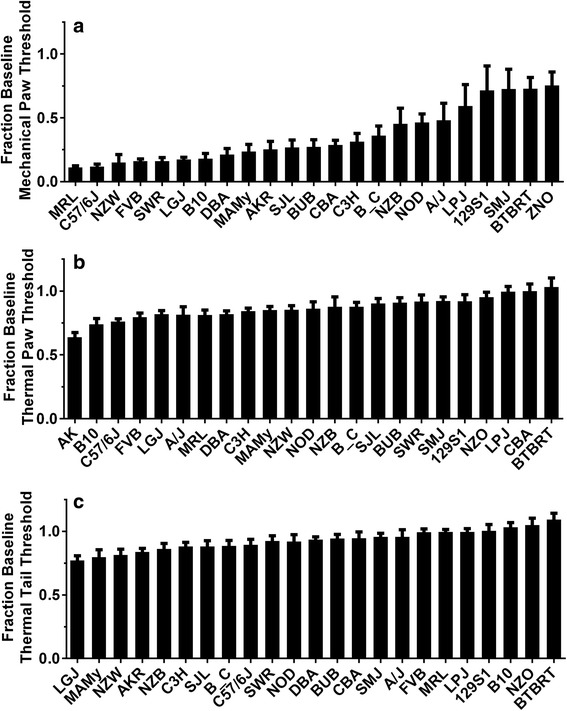
Opioid-induced changes in nociceptive thresholds for 23 strains of mice. These data were reproduced from our earlier report [18]. In panel (a) the reduction in mechanical nociceptive thresholds are displayed as a fraction of the baseline thresholds. The strains are displayed from the most to least robustly changed. In panel (b) thermal withdrawal thresholds measured using a Hargreaves’ apparatus are displayed as a fraction of baseline threshold. In panel (c) changes in thermal withdrawal threshold of the tail (tail flick) response are provided. For each trait the mean value is displayed +/− S.E.M., n = 8 mice per strain