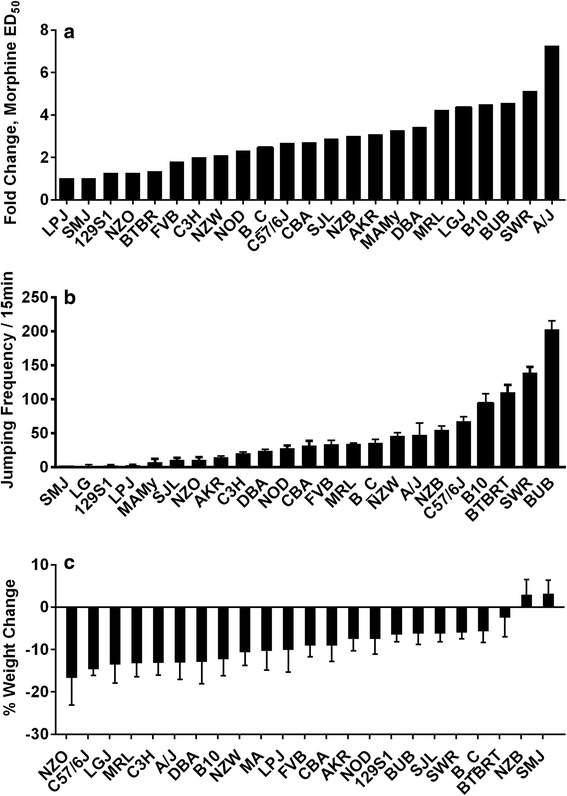
Fig. 2.

Morphine tolerance, dependence and weight change for 23 strains of mice. Some data were reproduced from our earlier report [18]. In panel (a) the fold change in the ED50 values for morphine dose–response curves are provided. In panel (b) the number of jumps exhibited by the mice in the 15 min period following the administration of naloxone are displayed. In panel (c) the change in weight as a fraction of baseline for each of the 23 strains used in these experiments are provided. For each trait the mean value is displayed +/− S.E.M., n = 8 mice per strain
