Fig. 6.

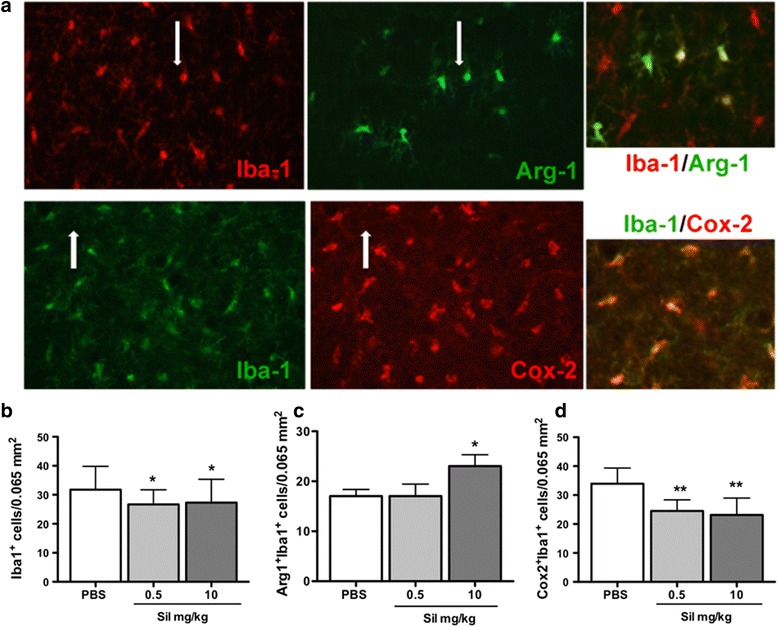
Effect of sildenafil on the number of Iba-1-positive microglia and M2 and M1 phenotypes 8 days after pMCAo. a Typical example of double fluorescence labeling in the cortical penumbra for Iba-1 and Arg-1 and Iba-1 and COX-2 cells in a PBS-treated animal. Note that almost Iba-1+ cells are co-stained with COX-2 marker (white arrows), which is not the case for double-stained Iba-1+-Arg-1+ cells. b–d Quantification of the number of Iba-1+, Iba-1+-COX-2+, and Iba-1+-Arg-1+ microglia cells in PBS-treated and sildenafil-treated (0.5 and 10 mg/kg) animals. Data are mean ± SEM. Data were assessed via an ANOVA, and when significant, the results of the Newman-Keuls post-test are shown. *p < 0.05, **p < 0.01, sildenafil vs PBS treatment
