Fig. 1.

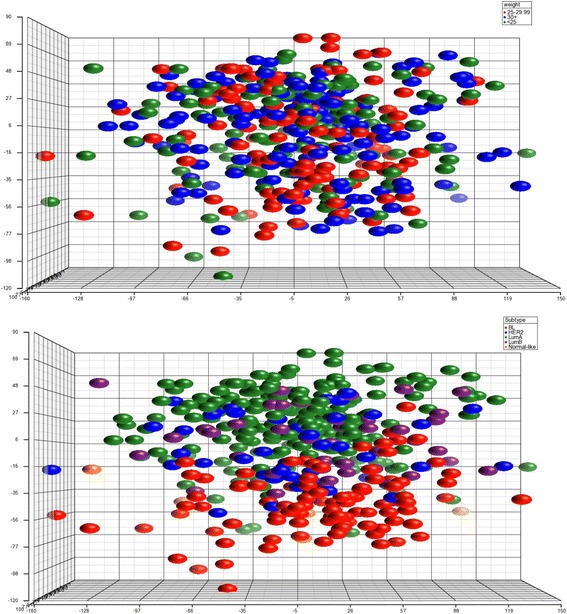
PCA of gene expression from 405 primary tumor samples. Plot on the top is colored by BMI groups with no obvious clusters detected. Plot on the left is colored by subtype and demonstrates grouping of the samples by subtype

PCA of gene expression from 405 primary tumor samples. Plot on the top is colored by BMI groups with no obvious clusters detected. Plot on the left is colored by subtype and demonstrates grouping of the samples by subtype